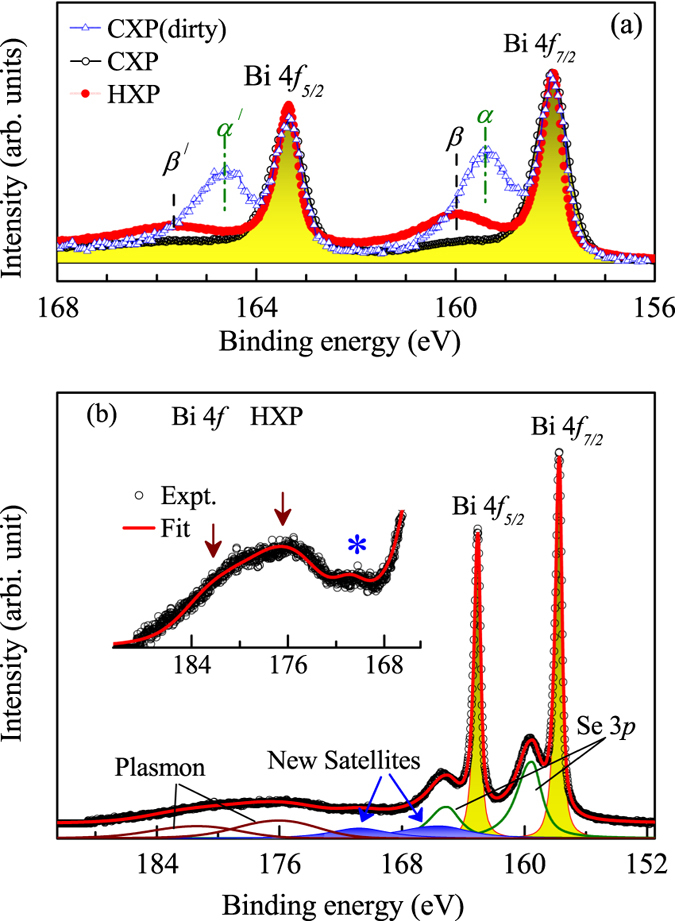
Figure 5.

(a) CXP and HXP spectra of Bi 4f level collected from cleaved and uncleaved (dirty) sample surface. (b) Bi 4f HXP spectrum (symbols) and the fitted spectrum (line). Area plots represent the component features constituting the spectral function. The inset shows the satellites (marked by arrows and *) in an expanded intensity scales.
