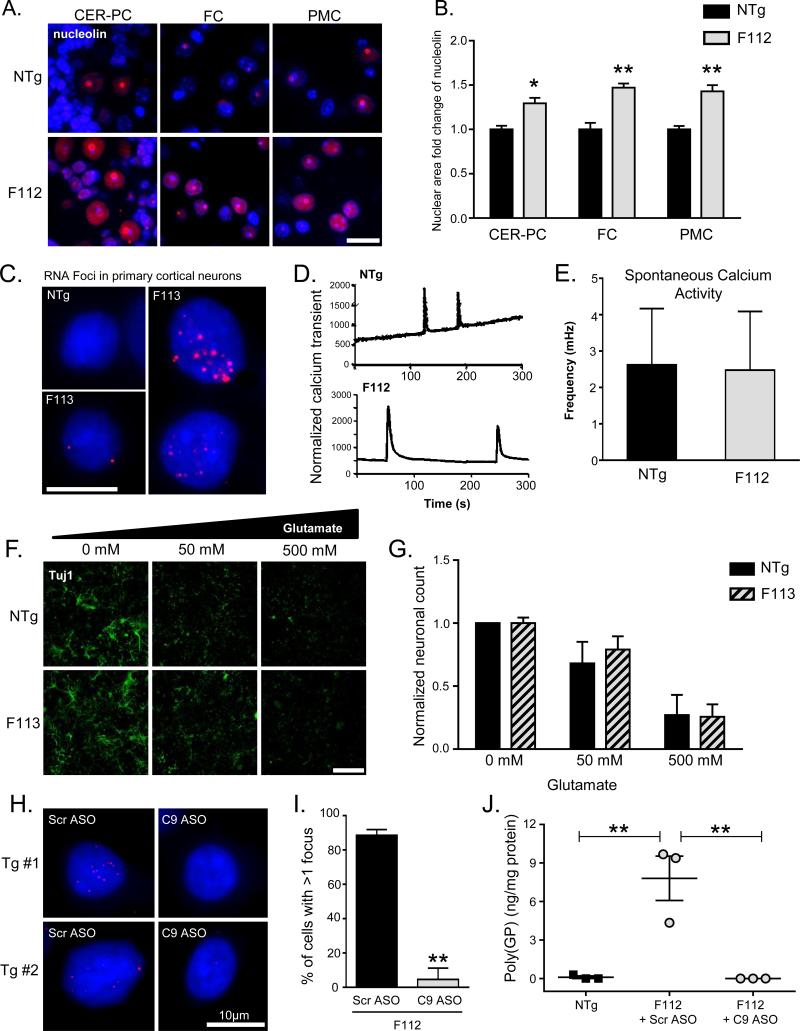
Figure 4. C9-BACexp mice show evidence of nucleolar stress, and decreased RNA foci and DPR proteins after antisense oligonucleotide treatment.
(A) Immunofluorescence staining of nucleolin (red) costained with DAPI (blue) in nontransgenic (NTg) and C9-BACexp (F112) mice in the cerebellar purkinje cells (CER-PC), frontal cortex (FC), and primary motor cortex (PMC). C9-BACexp mice showed partial displacement of nucleolin from the nucleolus. (scale bar = 20 μm)
(B) Quantitation of nucleolin staining distribution revealed a shift in the ratio of the amount of staining in the nucleus vs. the nucleolus (n=4 animals; two sided t-test, NTg vs. F112; *p<0.05; **p<0.01).
(C) RNA FISH of sense foci in primary cortical cultures from neonatal NTg and F113 C9-BACexp mice. RNA foci were observed in 73% (±9%) of neurons and astrocytes.
(D) Representative calcium recording from culture cortical neurons (NTg, top and F112, bottom).
(E) Frequency of calcium transients observed quantitated using Fluo-4 live imaging (n=27, NTg and n=68, F112).
(F) Glutamate toxicity assay in primary cortical neuron cultures showing Tuj1 staining after 24 hours of glutamate treatment at the indicated dose. (scale bar = 400 μm)
(G) The number of neurons (TuJ1 positive) were divided by total number of cells (DAPI, not shown) and then normalized to the controls (no treatment) for both F113 and NTg.
(H) RNA FISH of sense foci in primary cortical cultures treated with either control antisense oligonucleotides (Scr ASO) or an ASO targeting exon 2 of the human C9orf72 transcript (C9 ASO).
(I) Quantification of RNA foci reduction after C9 ASO treatment (**p=0.004, two sided t-test).
(J) Immunoassay showing reduction of poly(GP) DPR proteins in cortical cultures from C9-BACexp (F112 line) mice treated with C9 ASO compared to Scr ASO (**p=0.004,one way ANOVA). See also Figure S3.

