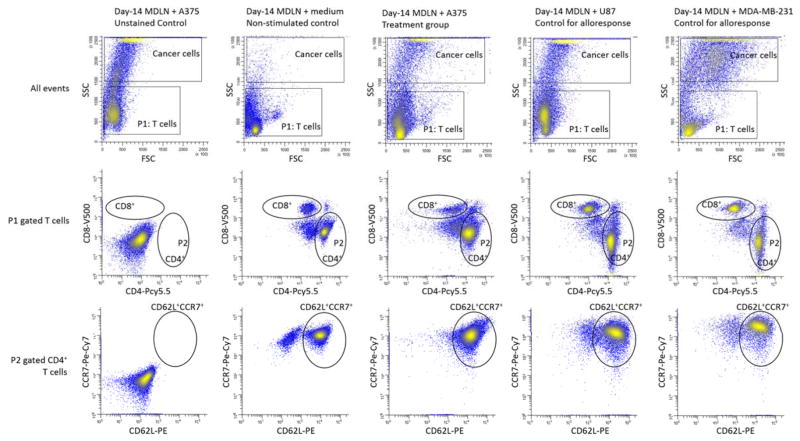
Figure 1.
FACS analysis of T cell subsets in day-14 MDLN co-cultures with medium, A375, U87 and MDA-MB-231. Various MDLN co-cultures were stained and analyzed by 11-color FACS. All events were gated by P1 to exclude tumor cells of greater sizes. The P1-gated T cells were analyzed using CD4-PCy5.5 vs CD8-V500. The P2-gated CD4+ T cells were analyzed using CD62L-PE vs CD8-Pe-Cy7. Unstained MDLN co-culture with A375 served as negative control to gate positive cells. MDLN co-culture with medium served as non-stimulated control to quantify baseline expression of various surface markers. MDLN co-cultures with low degree MHC-matching U87 and MDA-MB-231 served as controls to monitor allogeneic responses.

