
Figure.
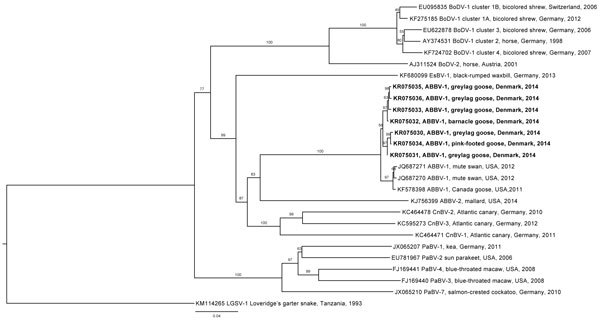
Phylogenetic tree comparing aquatic bird bornavirus 1 sequences obtained from waterfowl in Europe with selected bornavirus sequences from GenBank. Bold indicates viruses isolated in this study. Numbers along branches indicate bootstrap values. Scale bar indicates nucleotide substitutions per site.