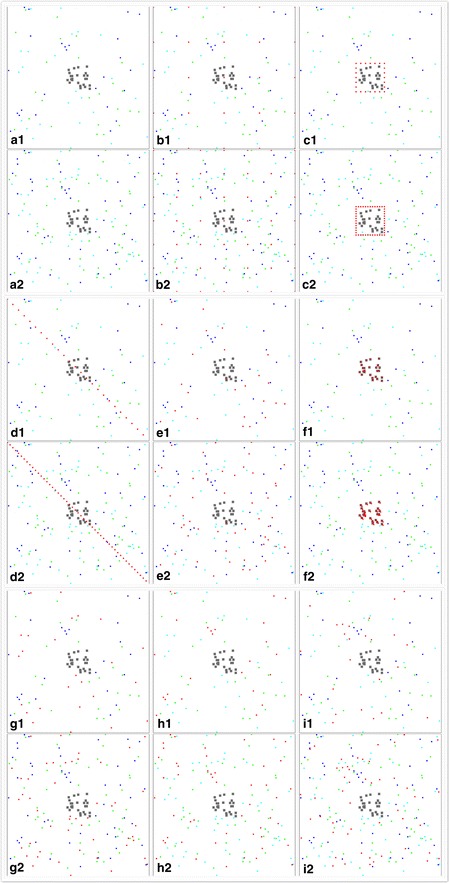
Fig. 1.

Configurations of ATSB stations in resource-rich and resource-poor environments. To be concise, the Figure contains only low-density (25) stations for resource-poor environments and high-density (50) stations for resource-rich environments. In each sub-figure, the grey dots represent houses, the green dots represent sugar sources, the light blue dots represent outdoor resting sites, the dark blue dots represent larval habitats, and the red dots represent ATSB stations. Sub-figures a1–i1 are control, 5 × 5 grid design, house periphery design, transect design, stations at sugar sources, stations at houses, stations at resting sites, stations at larval habitats, and stations at random locations in resource-poor environments; sub-figures a2–i2 are the same order of designs in resource-rich environments. In designs where stations were placed at resources (e.g., sugar sources), the dots representing the resources are hidden behind red dots and not shown. The series of n × n grid design are the same designs as b1 and b2, except that the numbers in each row and column are 0, 2, 3, 4, 5, 6, 7, 8, 9
