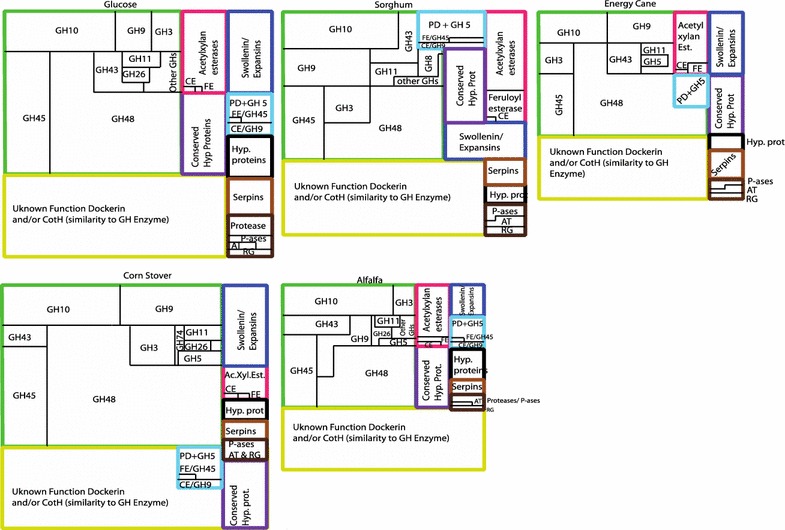
Fig. 4.

FDD-containing, putatively cellulosomal transcripts. Each square depicts transcriptional patterns under a specific growth condition as shown above the squares. The size of each square, and sections within, is proportional to the transcriptional level (normalized FPKM values). The sections are color coded by their predicted activity as follows: green GH families; dark blue swollenin/expansin accessory enzymes; pink acetylxylan esterases, carboxyl esterases (CE), and feruloyl esterases (FE); black hypothetical proteins; purple conserved hypothetical proteins; brown protease inhibitors (serpins); dark brown serine and threonine protein phosphatases (P-ases), alkyl transferases (AT), proteases, and rhamnogalacturonases (RG); light blue dual-activity enzymes including polysaccharide deacetylases (PD)/GH5 proteins, feruloyl esterases (FE)/GH45 proteins, and carboxyl esterases (CE)/GH9 proteins
