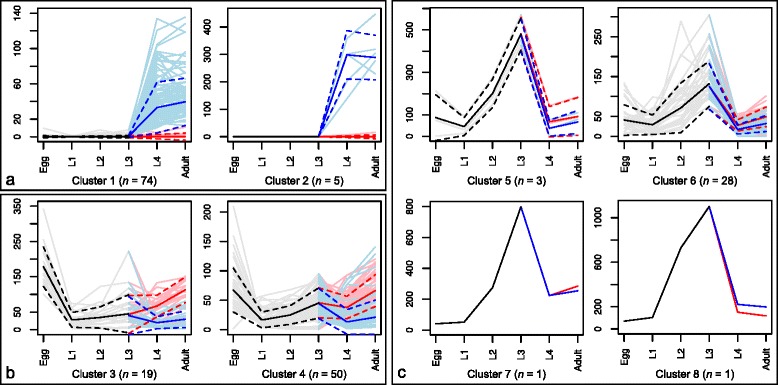
Fig. 1.

Selected clusters of transcription profiles for kinase genes based on the Ward-clustering method (k = 15). Male-enriched clusters (a), egg-enriched clusters (b) and L3-enriched clusters (c) are shown. Transcription levels are represented as transcripts per million (TPM) values on the y-axis (scaled individually according to the highest value within each cluster) and developmental stages (egg, L1-L4 and adult) of Haemonchus contortus are shown on the x-axis. Shaded lines represent individual transcription profiles; bold lines represent the Lowess trend line ± standard deviation (dashed lines). For the L4 and adult stages, both sexes are plotted (red = female; blue = male). The complete set of 15 clusters is shown in Additional file 2: Figure S2
