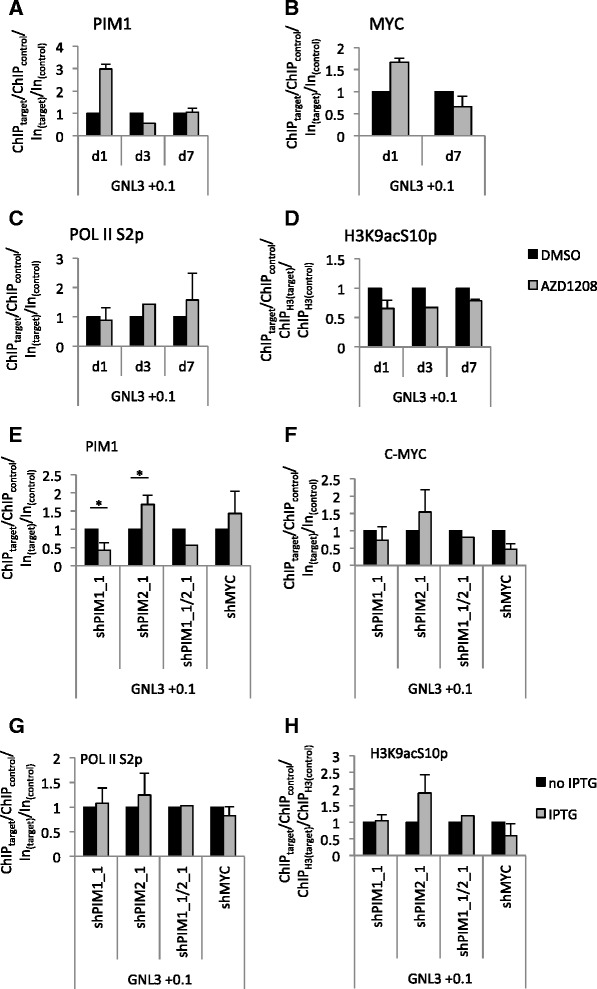
Fig. 5.

PIM2 knockdown increases PIM1 binding to the GLN3 promoter. a-d ChIP was performed in Raji cells after AZD1208 treatment. The cells were treated with 5 μM AZD1208 or DMSO from day 0 for 1, 3 or 7 days. ChIP was done with antibodies against PIM1 (a), c-MYC (b), H3K9acS10p (c) or Pol II S2p (d). Results are normalised to input or H3 and control regions (CTCF1 and CTCF2 for PIM1, c-MYC and Pol II S2p, CTCF2 and GNL3 + 9 for H3K9acS10p) and DMSO-treated cells. The means and SD of 2 independent experiments are shown for days 1 and 7, the result of one experiment is shown for day 3. e-h ChIP was performed in untreated or IPTG-treated pLKO-shRNA-transfected cells. Antibodies against PIM1 (e), c-MYC (f), Pol II S2p (g) or H3K9acS10p (h) were used. The results are normalised to input and control regions (GNL3 -3.5 and GNL3 + 9 for PIM1 and c-MYC (e, f), CTCF1 and GNL3 -3.5 for Pol II S2p (g) and CTCF1 for H3K9acS10p (h)) and plotted relative to untreated cells. Means and SD of n independent experiments are shown, with n = 3 for shPim1, n = 3 for shPim2, n = 1 for shPim1/2 and n = 2 for shcMyc. For n = 3 experiments, two-tailed Student’s t test was performed: *p < 0.05
