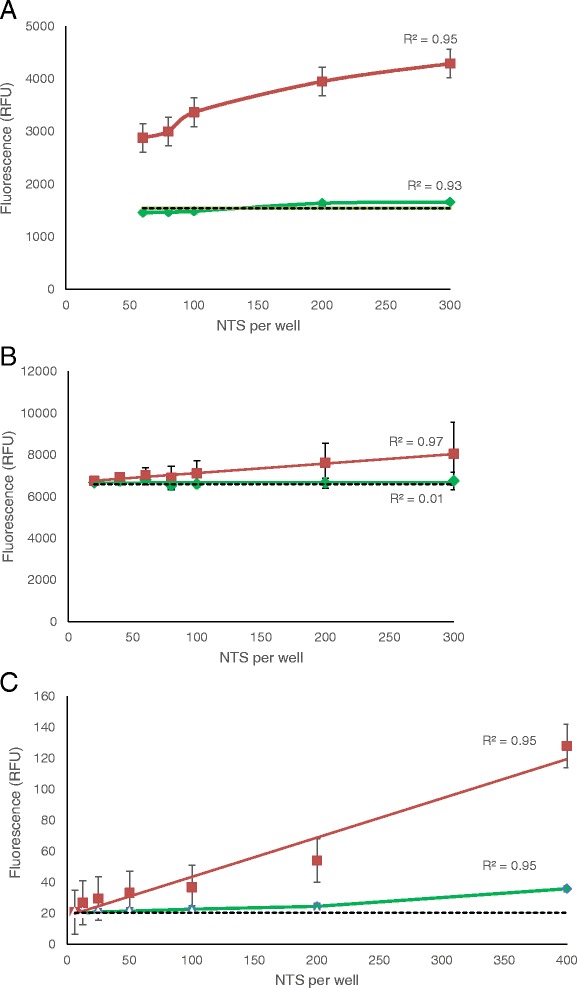
Fig. 2.

Correlation to NTS concentration for cytotoxicity markers a Vybrant®, b CytoTox-ONE™ and c CellTox™ Green. Green lines represent data from live NTS and red lines represent data from dead NTS. The dotted line represents the background signal from medium-only wells. Curves are shown for the optimal incubation time for each marker: 70 min for Vybrant®, 2 hours for CytoTox-ONE and 24 hours for CellTox™ Green.
