Fig. 15.

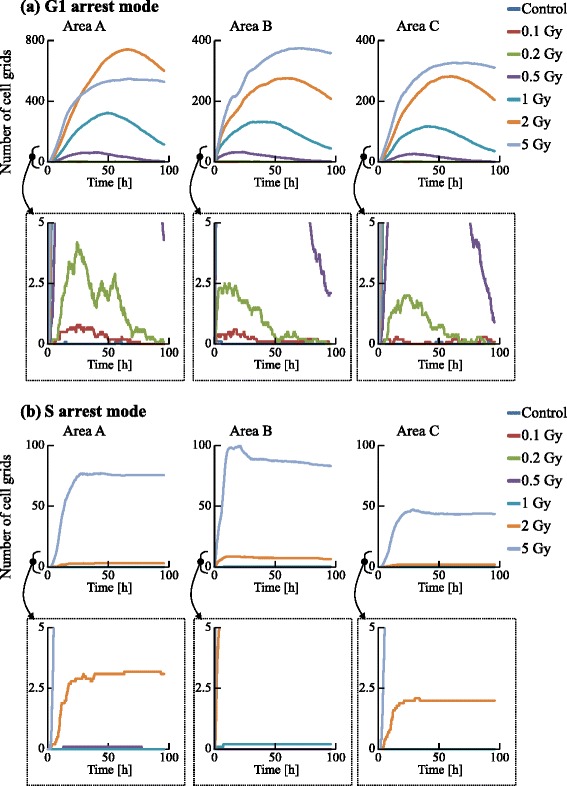
Time courses of the number of cells in the G1 and S arrest modes. The numbers of cell grids in the G1 and S arrest modes were counted at each time. The horizontal axis indicates the time. Each color represents a radiation dose

Time courses of the number of cells in the G1 and S arrest modes. The numbers of cell grids in the G1 and S arrest modes were counted at each time. The horizontal axis indicates the time. Each color represents a radiation dose