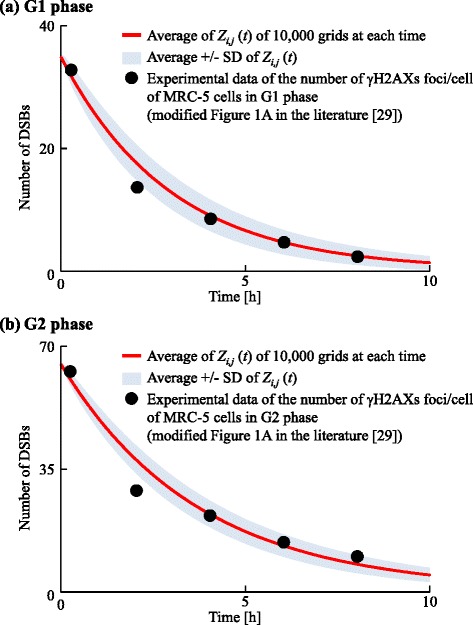
Fig. 8.

Data fitting for the change of the number of DSBs with time. The red line represents the average number of DSBs, Z i,j(t). Black points represent the experimental data of the number of gamma-H2AXs foci/cells or MRC-5 cells in the G1 or G2 phases (modified from Fig. 1a of [29]). We calculated Z i,j(t) for (a) the G1 phase and (b) the G2 phase
