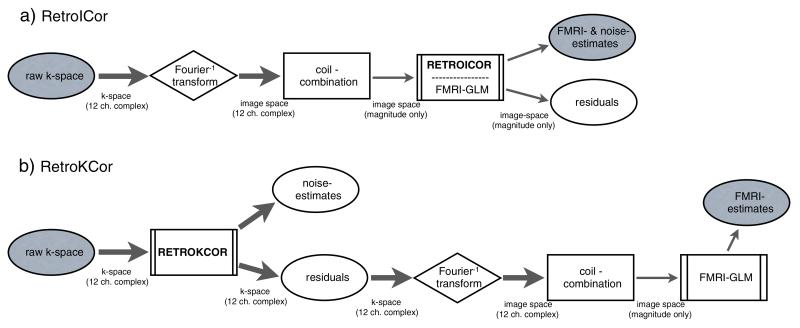
Fig. 1.
Reconstruction flowchart for RetroKCor and RetroICor. a: RetroICor corrections take place at the end of the reconstruction pipeline. The physiological noise regression can be included in the FMRI GLM analysis and is (typically) only performed on the magnitude data. b: RetroKCor corrections are performed on the complex k-space data. The residuals are the corrected data, which are further reconstructed to produce the eventual corrected images. Thick arrows represent multi-channel, complex, data, whereas the thin arrows represent combined, magnitude-only, data.

