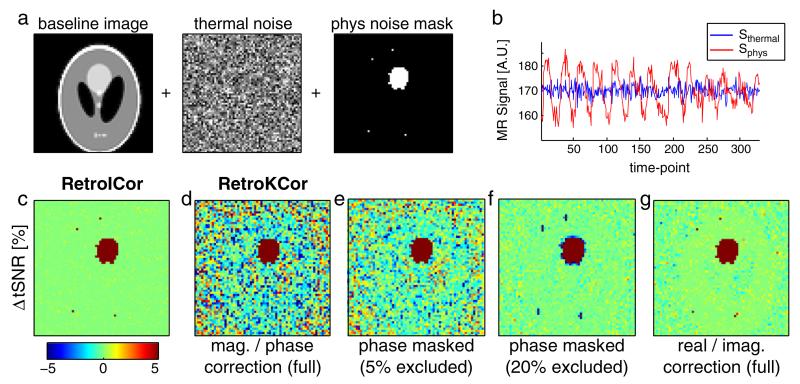
Fig. 2.
Simulation experiments. a: the simulation pipeline showing the addition of thermal noise (globally) and physiological fluctuations (within the mask shown on the right). b: example time courses of the simulated noise (SNR = 100, pCNR = 10). c–g: the difference in tSNR after correction with RetroICor (panel c) compared to various optimizations of RetroKCor (panel d–g). Red and blue denote increase and decrease in tSNR after noise correction, respectively.

