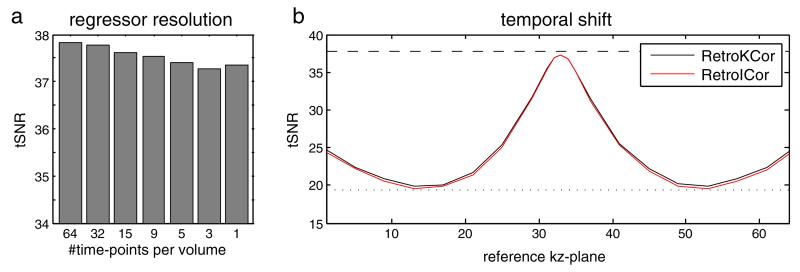
Fig. 4.
3D simulation results showing the tSNR within the simulated noise region after regression. a: the effect of regressor resolution. b: the effect of temporal shift. The tSNR when only thermal noise is simulated is 37.8 whereas the tSNR with simulated physiological fluctuations is 19.5 denoted by the striped and dotted line in (b), respectively. The best results are achieved when 64 regressors are used (segment-specific regression). The tSNR drops with decreasing temporal resolution, although the effect is small. When only 1 time-point is used per volume, the optimal reference time-point is the time at which the center kz-plane is acquired. A shift in either positive or negative direction causes the regression to become less affective.

