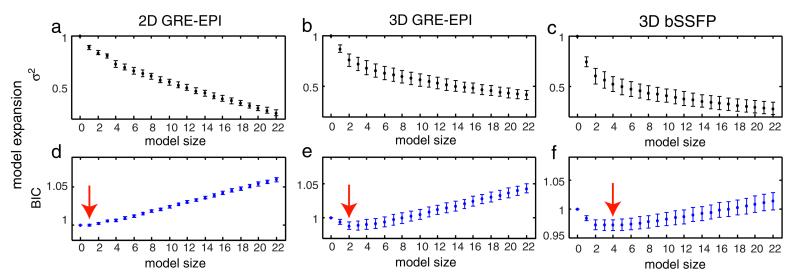
Fig. 6.
a–c: the residual variance after each model expansion step for 3D GRE-EPI, conventional bSSFP, and cardiac-synchronized bSSFP, respectively. d–f: The corresponding BIC values for each model expansion. The minimum BIC value for each sequence is marked by the red arrow. All plots represent the group mean with error bars representing standard deviation.

