Figure 2.

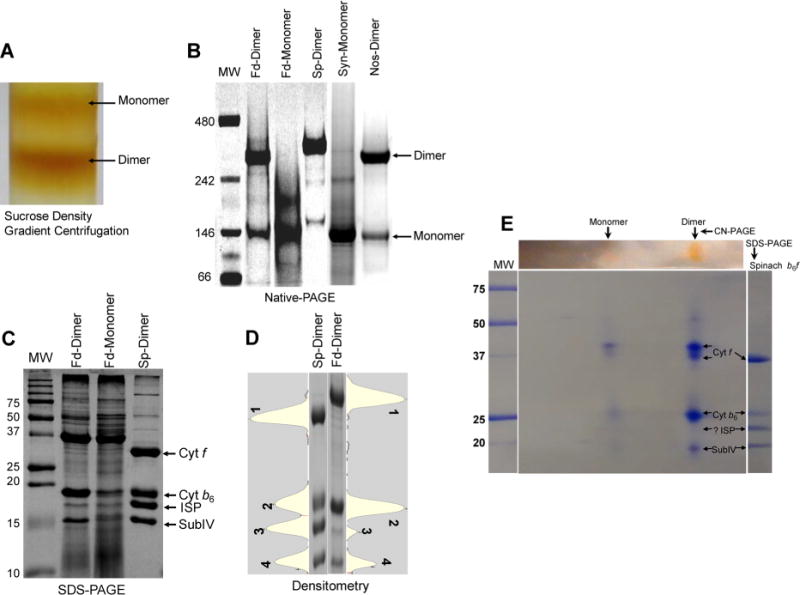
Biochemical characterization of the oligomeric state of the cyt b6f complex isolated from F. diplosiphon SF33. (A) Sucrose density gradient profile of the cyt b6f complex from F. diplosiphon SF33 eluted from a Ni affinity chromatography column, showing the presence of the monomer and dimer. (B) Native gel electrophoresis of the purified cyt b6f complex dimer (Fd-dimer) and monomer (Fd-monomer) from F. diplosiphon SF33. Purified cyt b6f from spinach (Sp-dimer), Synechocystis PCC 6803 (Syn-monomer), and Nostoc PCC 7120 (Nos-dimer) were used as controls for comparison. Molecular mass standards (MW, in kilodaltons) are also shown (lane 1). (C) Subunit composition of the cyt b6f complex analyzed by SDS–PAGE. F. diplosiphon SF33 dimer (Fd-dimer) and monomer (Fd-monomer) show prominent bands corresponding to three large subunits, i.e., cyt f, cyt b6, and subIV. The band corresponding to ISP was comparatively faint. Purified dimeric cyt b6f from spinach (Sp-dimer) was used as a standard for comparison. Molecular mass standards (MW, kilodaltons) are shown. (D) Densitometry profile of the four large cyt b6f subunits from spinach (Sp-dimer, lane 1) and F. diplosiphon SF33 dimer (Fd-dimer, lane 2). Cyt f, cyt b6, ISP, and subIV are labeled 1–4, respectively. The corresponding lane profiles are shown adjacent to the gel image. (E) Two-dimensional CN-PAGE of the cyt b6f dimer from F. diplosiphon SF33. Ten micrograms of the protein was resolved via 4 to 12% CN-PAGE in the first dimension followed by 12% SDS–PAGE in the second dimension. The gel was Coomassie-stained for visualization. Protein spots corresponding to cyt f, cyt b6, and subIV are visible. For reference, molecular mass standards (MW, kilodaltons) are shown in the left-most lane, and spinach cyt b6f is shown in the right-most lane.
