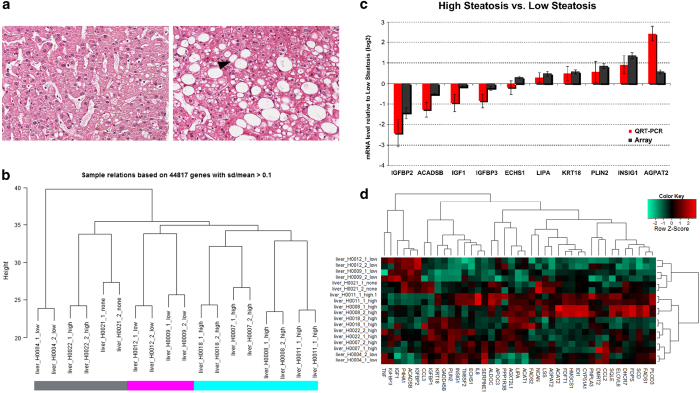
Figure 2. Histopathological and transcriptome characterization of liver tissue.
(a) Liver tissue with only marginal pathological changes (H9, low-grade steatosis group). The hepatocytes are arranged in one cell thick plates, separated by sinusoids. They contain only few small isolated fat valuoles (H&E stained section). Hepatocytes of the intermediate and central lobular areas contain macrovesicular fat (image to the right, H8, steatosis group, hepatocytes with fatty change are indicated by arrow heads; H&E stained section). (b) Hierachical clustering of the transcriptomes of patient liver samples. We identified three clusters: high (>33%) steatosis (cyan), low (5–33%) steatosis (magenta) and heterogeneous clusters of high, low and no steatosis (grey). (c) Quantitative QRT-PCR confirmation of genes differentially expressed in high versus low steatotic livers. The columns represent the mean of four biological replicates (high steatosis) versus two biological replicates (low steatosis). Error bars indicate standard errors of the mean. Array-derived and RT-PCR-derived columns are depicted in dark grey and red respectively. (d) Heatmap of genes differentially expressed in high versus low steatotic livers and genes found in literature and in genome-wide association studies.

