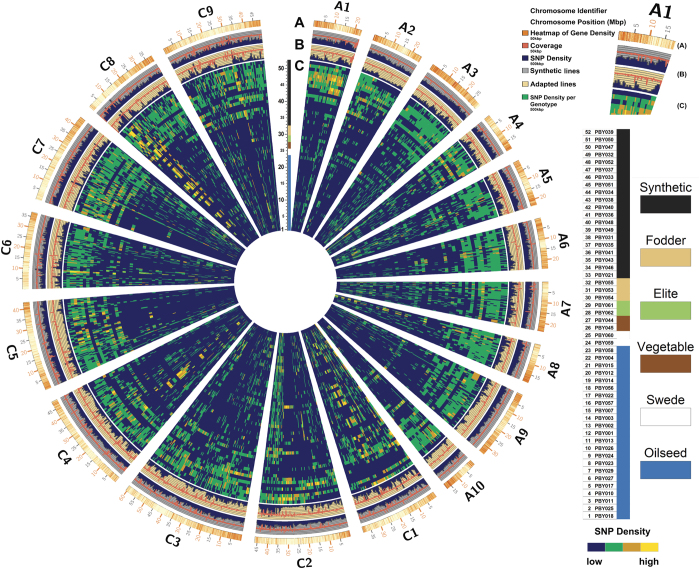
Figure 2. Diversity plot of 3.28 million variant positions (VPs, including SNPs and InDels) with defined chromosome positions visualized with Circos20.
The illustration shows the 19 chromosomes of the Brassica napus genome, ten from the A subgenome and nine from the C subgenome. The outermost track (A) displays the position of genes and the corresponding scale in Mbp. The distribution of gene models shows that genes are abundant in distal euchromatin compared to the marginal packing in centromeric regions. The two subsequent tracks (B) illustrate the comparative mean diversity between the two subgroups of natural and synthetic B. napus accessions as a blue histogram plot, and the average read coverage as red line plot, respectively. The mean diversity is calculated for each of the subgroups by using the number of identified VPs in a 500 kb window, divided by the number of accessions per subgroup. The inner tracks (C) display the observed diversity (number of VPs) for each of the resequenced 52 genotypes, illustrated as heatmaps by using SNP densities in 500 kb windows. Genotypes are ordered by the six subgroups (synthetic, fodder, elite, vegetable, swede and oilseed) and within each subgroup by descending number of VPs.

