
Figure 3. Distribution of discovered InDel sizes.
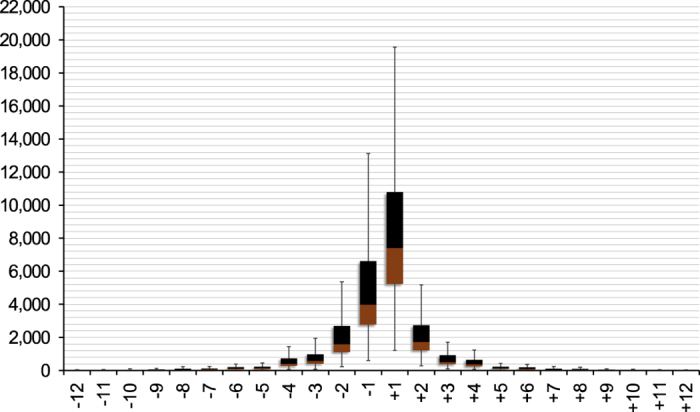
InDel calls of all 52 genotypes were evaluated. The plot displays the range between the quartiles Q1 and Q3 for a particular InDel size. Around 50% of all genotypes had InDel numbers within the depicted range. The boundary between the lower (brown) and upper (black) field for a particular InDel length represents the average number of InDels of that length which were detected in all of the 52 sequenced accessions.