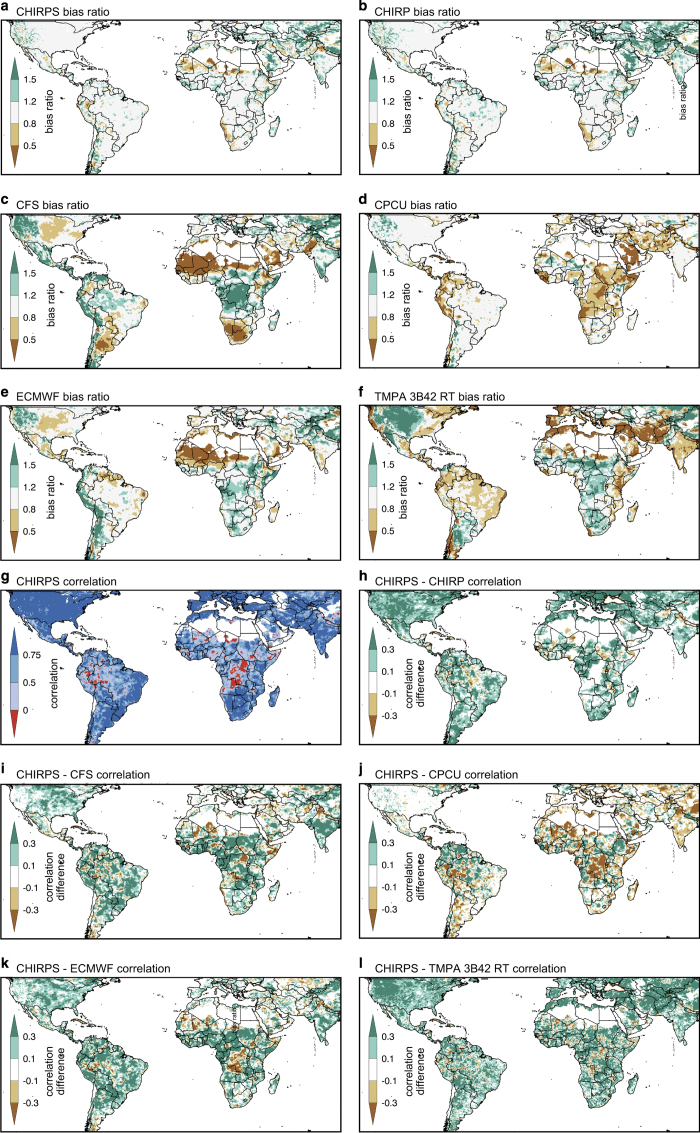
Figure 3. Wet season validation results.
(a–f) Wet season bias based on comparison with 2000–2010 GPCC data. Bias is defined as the ratio between the mean of the validated product and mean GPCC precipitation. (g) Wet season correlations between the CHIRPS and GPCC (h–l). Difference between the CHIRPS and GPCC correlation map (g) and the corresponding correlation maps with the other products and the GPCC.

