
Figure 1.
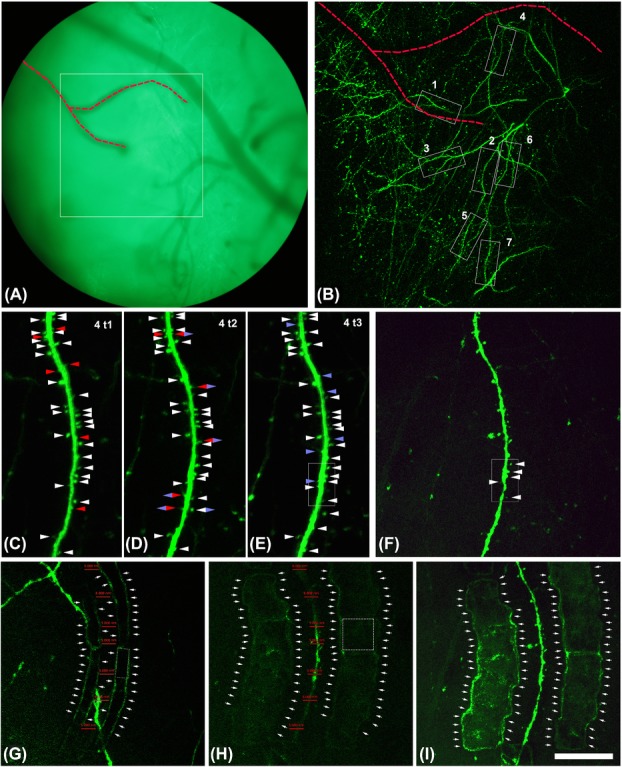
2P in vivo imaging of layer I dendrites of pyramidal neurons over time. (A) Blood vessel distribution was used in addition to coordinate setting to accurately relocate the same position for 2P imaging over time. Square in (A) surrounds the area that was imaged in (B). (B) Overview of the selected dendrites taken in vivo for the correlative approach. Stack of 100 images with a z-step of 3 μm. Note that the dashed red line indicates the same blood vessels in (A) and (B) that are useful to relocalize the dendrite 4. The same blood vessels are indicated in Figure2. C–E: Dendrite 4 imaged in vivo at different time points (1 week between t1 and t2; 1 day between t1 and t2). Stack of 20 images with a z-step of 1 μm. Note that white arrow heads point out spines that were present during the whole imaging period. Red arrow heads point out spines that will disappear in the next time point. Blue arrow heads point out spines that appear in this time point. Blue and red rhombus point out spines that appear in this time point but they are no longer present in the next time point. Blue and white rhombus points out spines that appear in this time point and that are present until the last imaging time point. (F) Dendrite 4 imaged ex vivo in the thick section before the laser marking. Note that the white rectangle present in (E) and (F) surround the dendritic segment that was further imaged and reconstructed with the FIB/SEM (see Fig.3). Stack of 20 images with a z-step of 1 μm. (G–H) Single plane of dendrite 4 relocated ex vivo in the thick section after the laser marking, 10 μm over the dendrite (G) and in the same focal plane of the dendrite (H). Marks are necessary to recongnize the region that has to be scanned with the FIB/SEM. Marks (single crop frame around 10 × 10 μm, dashed line cube in H) were made around the dendrite of interest in the central focal plane of the dendrite (around 5–10 μm far from the dendrite (H). Ten micrometers over this central plane other smaller marks (single crop frame around 10 × 5 μm, dashed line rectangle in G) were made resembling the profile of the dendrite (G). Note that red lines in G and H are located in the same position in both images and their size is 5 μm. Thus, it is observed how the marks made 10 μm over (G) resemble perfectly the shape of the dendrite located below (H). (I) Maximum intensity projection of dendrite 4. Stack of 20 images with a z-step of 1 μm. Laser marks are clearly visible. In (G–I), arrows point out the outer limit of the NIRB marks. Scale bar (in I): 134 μm in A, 89 μm in B, 19 μm in C–F, 26 μm in G–I.