Figure 3.

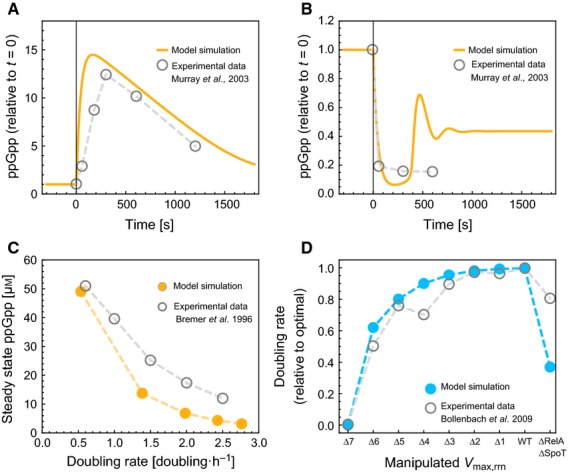
The self-regulation model of protein synthesis incorporating ppGpp control reproduces experimental data. Model predictions (coloured lines or discs) are compared with experimental data from the literature (grey circles). (A) Dynamic response of ppGpp to a nutritional downshift at t = 0. Experimental data is reproduced form Murray et al. 51. Lazzarani & Cashel 55 report similar dynamics (not shown). (B) Dynamic response of ppGpp to a nutritional upshift at t=0. Experimental data is reproduced form Murray et al. 51. (C) Dependence of the steady state ppGpp concentration on growth rate. Data reproduced from Bremer & Dennis 13. The steady state ppGpp concentration decreases with increasing growth rate because higher ribosome concentrations require a higher rate of ribosome synthesis. (D) The effect of rRNA operon number or SpoT and RelA knockout on growth rate. Δx indicates that x out of 7 rrn-operons were knocked out. Data are reproduced from Bollenbach et al. 58.
