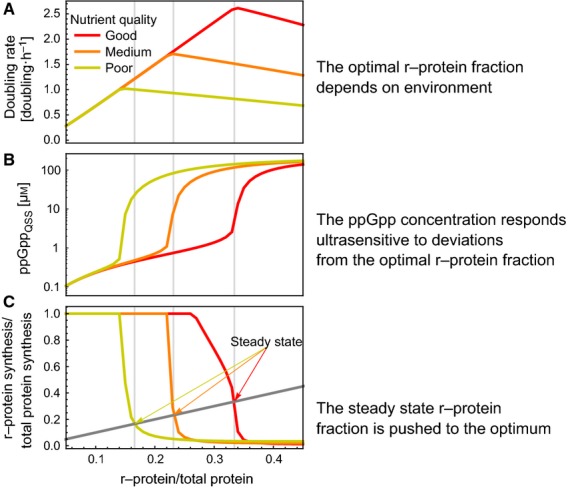
Figure 4.

The ultrasensitive response of the ppGpp concentration to deviations from the optimal r-protein fraction lead to optimality across conditions. We computed the response of the system to deviations from optimal r-protein fractions for three different nutrient conditions (indicated by the different colours). (A) Doubling rate. (B) the ppGpp concentration. (C) the r-protein synthesis and degradation rate (relative to the total protein synthesis rate), as a function of the r-protein fraction. (A) The optimal growth rate and ribosome protein fraction together form the linear relationship, as discussed in the main text. (B) The quasi steady state ppGpp concentration changes strongly from around 1 μm when the r-protein fraction is just below its optimum to 100 μm when it is just above it. This is a consequence of the strong response in the levels of uncharged tRNA bound to the ribosome (see Fig. S3). (C) The system is in steady state when r-protein synthesis and dilution (dark grey line) rates are equal. This is indicated by the vertical grey lines. Note that these lines almost coincide with the optimal r-protein fractions. Regulation of ribosome synthesis always pushes the system back to optimal levels: if the ribosome concentration is too low, ppGpp is low as well and so synthesis exceeds degradation, and vice versa.
