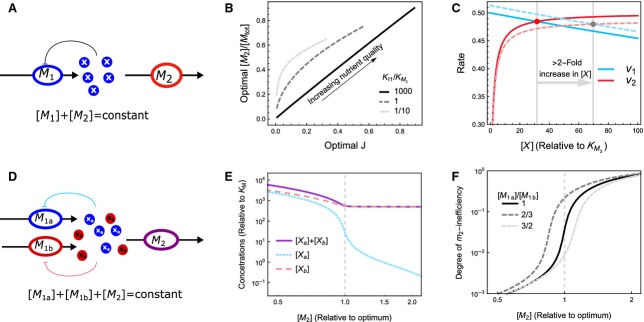
Figure 5.
Minimal models that achieve optimal protein concentrations to maximize metabolic pathway flux per total invested protein. (A) The metabolite X is synthesized by metabolic enzyme M1 and consumed by M2, whereas the total amount of protein resources is fixed: [M1]+[M2]=[Mtot]. A mathematical description of the model is provided in Doc. S2. (B) The relationship between optimal [M2] and the maximal flux. The maximal flux is increased by increasing the nutrient availability. At large values of the ratio of the product inhibition constant (KI1) over the Michaelis constant (KM2) the optimal [M2] increases linearly with the optimal flux J (black solid line). This linear relationship breaks down when KI1 is not much larger than KM2. (C) The rates v1 and v2 as a function of [X]. Solid lines indicate the optimum where [M2]=0.5·[Mtot] and dashed lines indicate a slight deviation from optimality, [M2]=0.49·[Mtot]. The steady states are indicated by a red and grey dot, respectively. Clearly, a small change in [M2] brings about a large change in steady state [X]. (D) A model of two converging pathways. Both metabolites Xa and Xb are required as a substrate for M2, and have weak feedback inhibition (i.e. K1a and K1b are much larger than KM2a and KM2b, respectively). (E) Because consumption of Xa and Xb are stoichiometrically coupled, the concentration of the non-limiting metabolite (here [Xb]) remains high, even when [M2] is higher than optimal. Hence, the metabolites are not a reliable signal for deviations from optimality. (F) The degree of inefficiency of M2, defined as 1−v2/Vmax, 2, responds ultrasensitively to deviations from optimality. This behaviour does not depend on the relative rate of Xa and Xb synthesis. Hence, this is a suitable regulatory signal.

