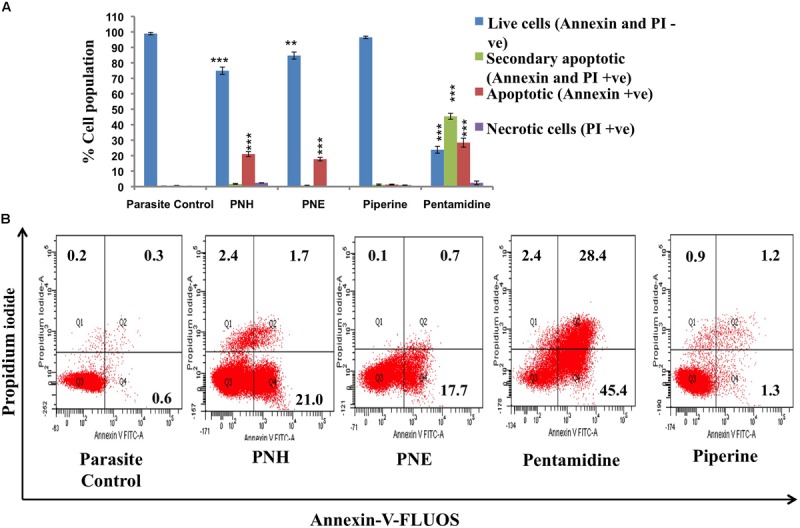
FIGURE 1.

Visualization of PS exposure. (A) Promastigotes (2 × 10⁶ ml-1) after treatment with test fractions and compounds (500 μg ml-1) for 72 h at 22°C were co-stained with Annexin-V-FLUOS and PI. The bar graph depicts percentages of live, apoptotic, secondary apoptotic and necrotic cells for different test samples. ∗∗∗P < 0.001 and ∗∗P < 0.01 with respect to parasite control. (B) FL-1 (x-axis) vs. FL-2 (y-axis) dot plots depicting live (both annexin and PI negative, lower left quadrant), necrotic (PI positive, upper left quadrant), apoptotic (annexin positive, lower right quadrant) and secondary necrotic (both annexin and PI postive) Leishmania parasites.
