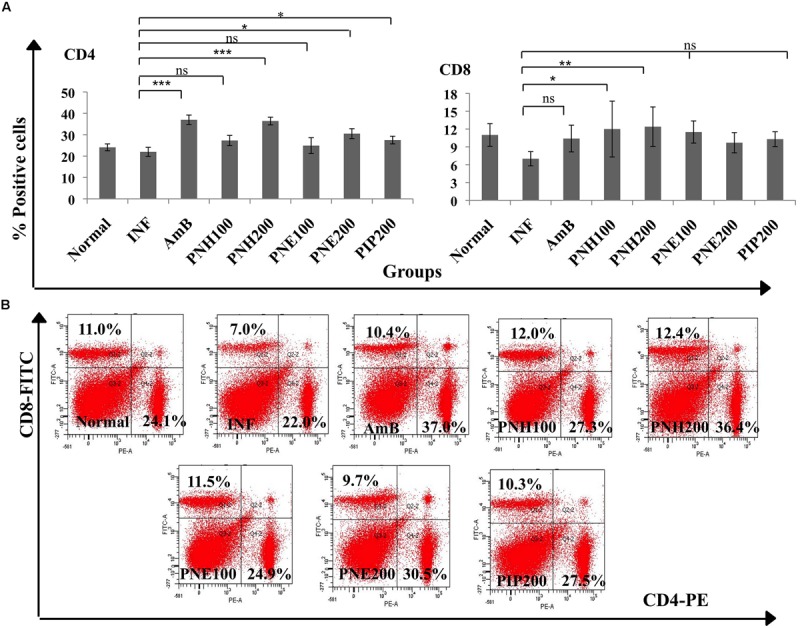
FIGURE 7.

Determination of changes in splenic T cell populations. (A) To distinguish CD4+ and CD8+ T cell population, co-staining with anti-CD4-PE and anti-CD8-FITC antibodies was performed as described in the Section “Materials and Methods”. Bar graphs display significant and non-significant changes in CD4+ and CD8+ T cell numbers post-treatment with bioactive fractions. ∗∗∗P < 0.001, ∗∗P < 0.01, ∗P < 0.05, and ns = non-significant with respect to INF. (B) Dot plots also depicting the changes in splenic CD4+ and CD8+ T cell numbers after treatment with P. nigrum bioactive fractions.
