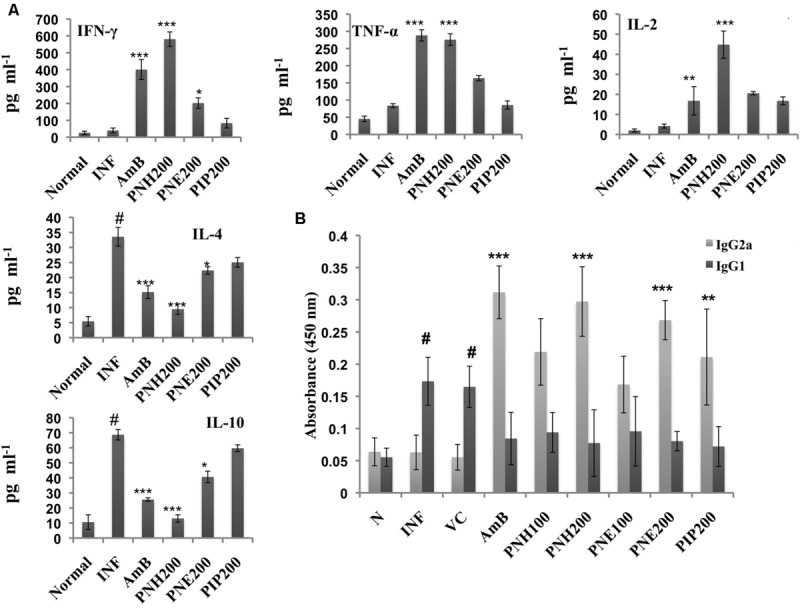
FIGURE 8.

Analysis of Th1 subset potentiation. (A) Estimation of Th1 and Th2 cytokine levels. INF-γ, TNF-α, IL-2, IL-4, and IL-10 were quantified in culture supernatants of splenocytes post 48 h of SLA stimulation as described in the Section “Materials and Methods”. #P < 0.001 in comparison to normal group, ∗∗∗P < 0.001, ∗∗P < 0.01, and ∗P < 0.05 with respect to INF. (B) IgG isotyping in sera of untreated and differently treated BALB/c mice. Leishmanial antigen specific IgG2a and IgG1 isotypes were quantified in BALB/c mice serum samples by ELISA. #,indicates significant elevation in IgG1 levels in INF and VC group in comparison to naïve mice. ∗∗∗P < 0.001, and ∗∗P < 0.01 with respect to INF.
