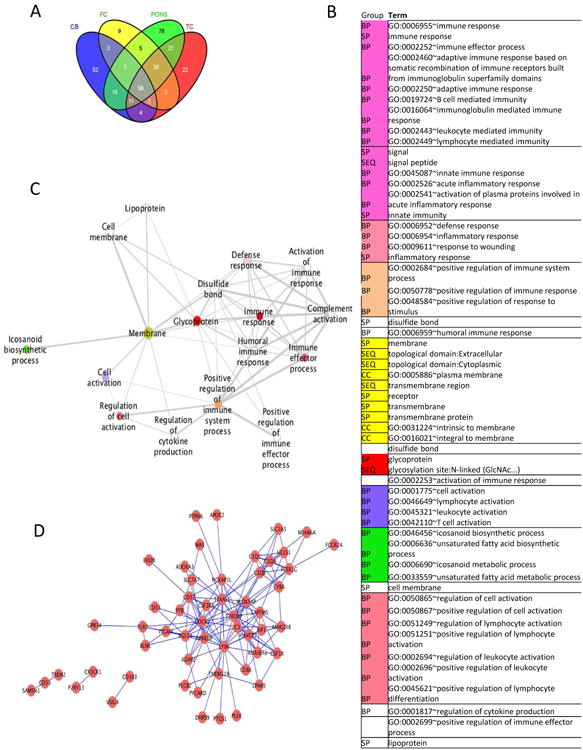
Figure 2. The immune response is enriched in gene co-expression modules from human brain.

A Venn diagram indicating the number of genes in common across the four modules that were found to be significantly enriched in the IGAP GWAS using ALIGATOR after correcting for multiple testing. Each significant module originates from a different brain region as indicated here (Cb = cerebellum, FC = frontal cortex, TC = temporal cortex). B Network showing the pathways significantly enriched for gene membership among the 151 genes present in at least two of the four most significantly enriched expression modules: the principal biological themes were derived from DAVID[33-34] analysis. Terms from the analysis were filtered at 0.05% FDR, progressively clustered according to average gene similarity at a threshold of 90% and rendered on Cytoscape with the Enrichment Map plugin[35-36]. The diagram shows only the principal (lowest FDR) term for each of the clusters and white nodes indicate a single term that does not cluster with other groups. Coloured nodes indicate a multi-term cluster: the related terms represented by each node are given in C, in increasing significance order. Sources of the functional terms are:
BP = GOTERM_BP_FAT: Gene Ontology biological processes in DAVID's GO Fat Database;
CC = GOTERM_CC_FAT: Cellular Component terms in DAVID's GO Fat Database;
SP = SP_PIR_KEYWORDS: keywords in the Uniprot (Swiss-Prot/Protein Information Resource) database
SEQ = UP_SEQ_FEATURE: Uniprot sequence annotation feature.
The full data are available in Supplementary Table 8
D Network showing the strongest correlations in expression (>0.9 in at least one brain area) between genes present in at least two of the four most significantly enriched expression modules.
