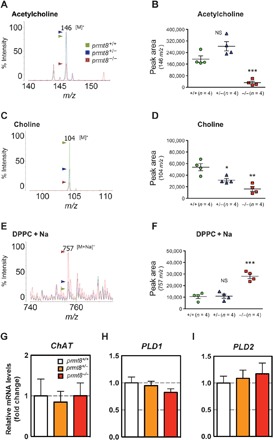
Fig. 2. Acetylcholine and choline are decreased, whereas PC levels are increased, in the cerebellum of prmt8−/− mice.

(A to F) Specific detection of acetylcholine, choline, and PC by MALDI-QIT-TOF/MS. Positive-ion mode mass spectrum of acetylcholine (m/z 146 [M]+) with α-cyano-4-hydroxycinnamic acid (CHCA), choline (m/z 104 [M]+) with 9-aminoacridine hemihydrate (9-AA), or DPPC (m/z 757 [M + Na]+) with 9-AA as matrix. The m/z ratios among the peaks are indicated. Among the three mouse genotypes (WT, heterozygous, and homozygous; n = 4 per genotype) examined, experimental ratios were determined by summing the ion peak areas. Data are shown as means ± SEM; *P < 0.05, **P < 0.01, ***P < 0.0001, or NS as compared to WT mice. (G to I) The mRNA expression of ChAT, PLD1, and PLD2 was analyzed by qPCR. Results are shown as fold change of mRNA expression relative to the mean value of the WT sample. Data were obtained using the ΔΔCt method normalized to the reference GAPDH mRNA (mean ± SEM, n = 4 per genotype; data were not significantly different).
