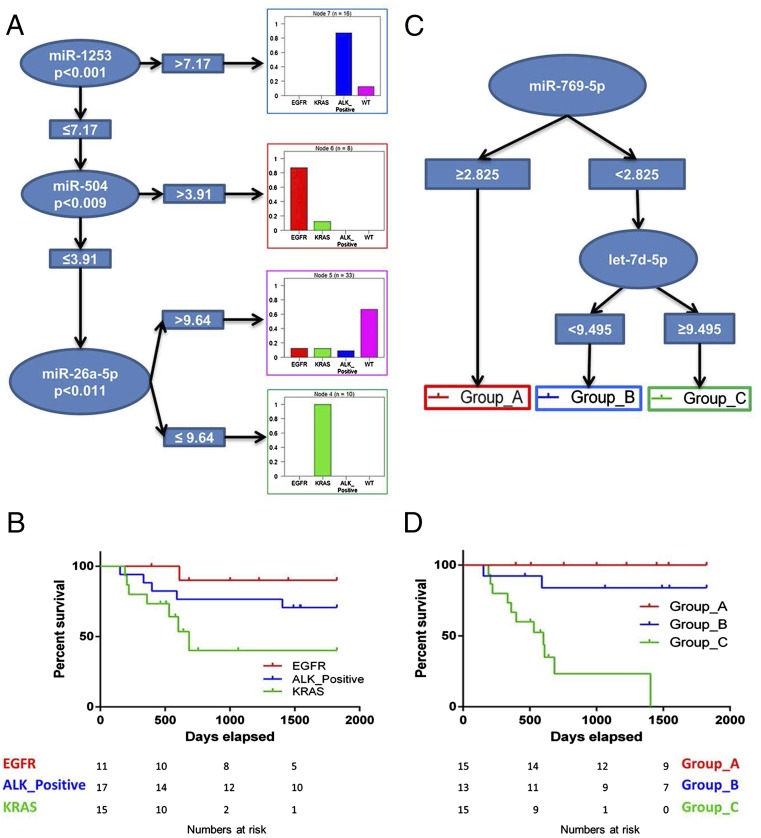
Fig. 2.
Prognostic and diagnostic miRNA signatures. (A) CTree representation of the diagnostic classifier based on three miRNAs that is able to distinguish the three different drivers and the WT status. (B) Kaplan–Meier plot of OS considering only the oncogenic driving alterations as stratification criteria. (C) CTree representation of the prognostic signature based on two miRNAs. (D) Kaplan–Meier plot of OS identified by the expression levels of two miRNAs as shown in C.

