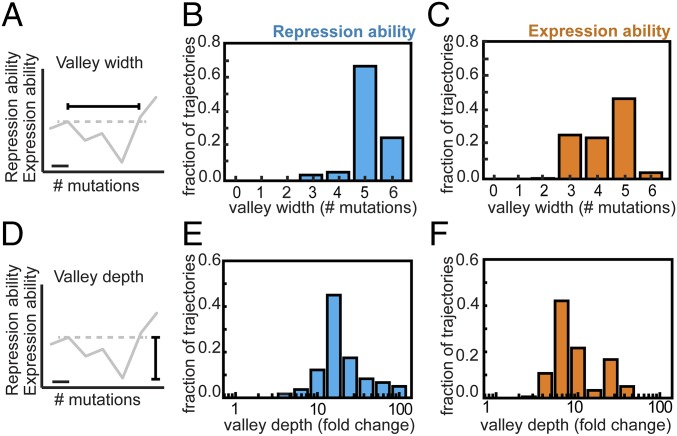
Fig. 2.
Genetic constraints in constant environments. (A) The valley width is the number of mutations required to increase repression or expression ability above the previous suboptimum in a given mutational trajectory. For each trajectory, the widest valley is tabulated. The horizontal bar indicates one mutation. (B) Valley width in repression ability for all direct 720 mutational trajectories from MK:acca to YQ:tggt. (C) Valley width in expression ability. (D) The valley depth is the fold decrease in repression or expression ability within the valleys of a given trajectory. For each trajectory, the deepest valley is tabulated. Note that the widest and the deepest valleys for a given trajectory do not necessarily coincide. (E) Valley depth in repression ability for all direct 720 mutational trajectories from MK:acca to YQ:tggt. (F) Valley depth in expression ability. Welch’s t tests were performed to determine the statistical significance of differences in measured repression and expression ability values (Methods).

