Fig. 4.
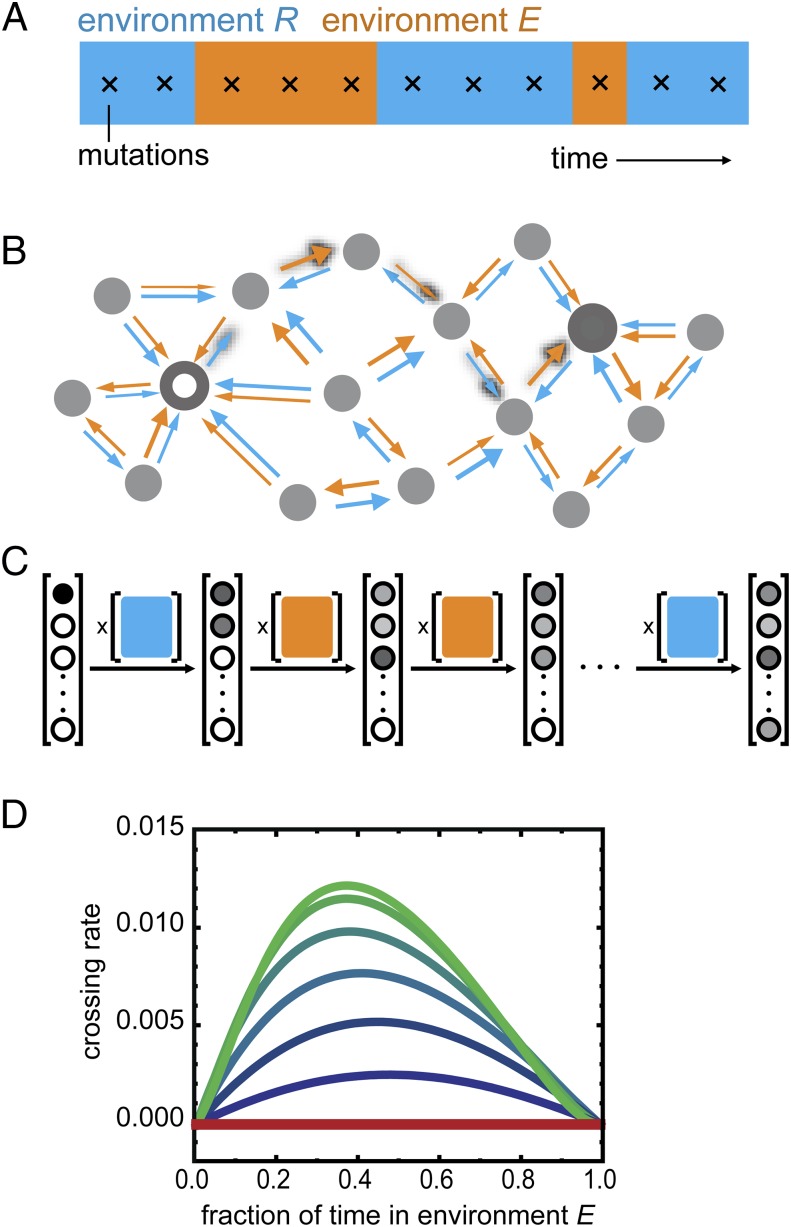
Landscape crossing in stochastically alternating environments. (A) Environmental fluctuations and occurrence of mutations (crosses) (SI Methods and SI Results, section S1). Environments R and E refer to the environment selecting for repression or expression ability, respectively. (B) Schematic representation of genotype space. Large white and gray circles are start and end genotypes, respectively, of mutational trajectories. Arrows indicate increasing repression ability (R; blue) or expression ability (E; orange); arrow thickness reflects magnitude and hence, transition probability (SI Methods and SI Results, section S2). Shadowed arrows indicate one possible path of continuous improvement from the initial to the final genotypes. The structure of the space is schematic and does not reflect the actual system. (C) Schematic depiction of the Markov chain method for computing crossing rates. The probability vector lists all N genotypes, with the gray scale indicating the probability of populating a genotype at a given indicated time. Initially, only the beginning genotype is populated. The N × N environment-dependent transition probability matrices (colored squares) reflect the arrows in B: a matrix entry at position i,j indicates the transition probability from genotype i to genotype j. Each matrix multiplication yields a novel probability of genotype occupancy after a mutation occurred in a given environment. This illustration is schematic: we use an (infinite time limit) analytical solution for this process, considering a range of possible scenarios of environmental fluctuations. (D) Crossing rate kc as a function of the fraction of time spent in each environment for different environmental fluctuation rates kf. The unit of time is the time between two mutations. The red line indicates environment dwell time <<1, meaning that the environment fluctuates much faster than the time between mutations. The top green line to bottom blue line indicates environment dwell times of c = 1, 2, 5, 10, 20, and 50 (i.e., decreasing kf or decreasing frequency of environmental fluctuation) (SI Methods and SI Results, sections S3–S6). The crossing rate is the inverse of the mean number of mutations that are necessary to cross the landscape. The absolute maximum crossing rate is 0.17 (6−1; corresponding to six mutations being fixed).

