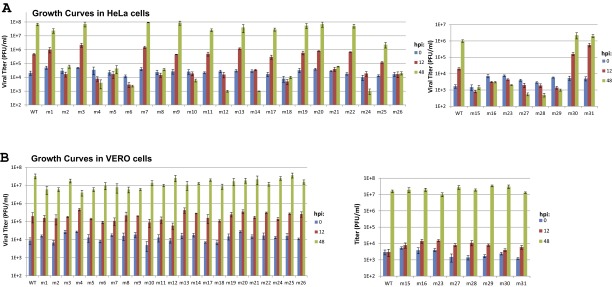
Fig. S3.
Growth curves of C7 mutant VACVs. HeLa (A) and VERO (B) cells in 12-well plates were infected with the indicated viruses at an MOI of 0.05 pfu per cell. Viral titers at 0, 12, and 48 hpi were determined by plaque assay on VERO cells. The mutants were studied in groups in two separate experiments, each with a WT VACV control. The experiment was repeated one time with similar results.

