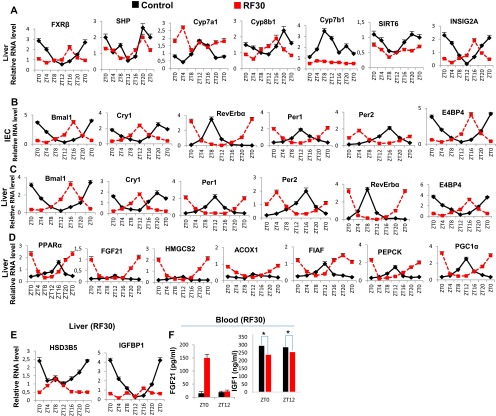
Fig. S3.
Metabolic features of RF30 mice. (A) RNA transcript levels of genes, as indicated, in liver of control and RF30 mice. (B) RNA transcript levels of CC components in IECs of control and RF30 mice. (C) RNA transcript levels of CC components liver of control and RF30 mice. (D) RNA transcript levels of genes, as indicated, in liver of control and RF30 mice. (E) RNA transcript levels of HSD3B5 and IGFBP1 in liver of control and RF30 mice. (F) FGF21 and IGF1 levels in blood of control and RF30 mice. All values are mean ± SEM. *P < 0.05.

