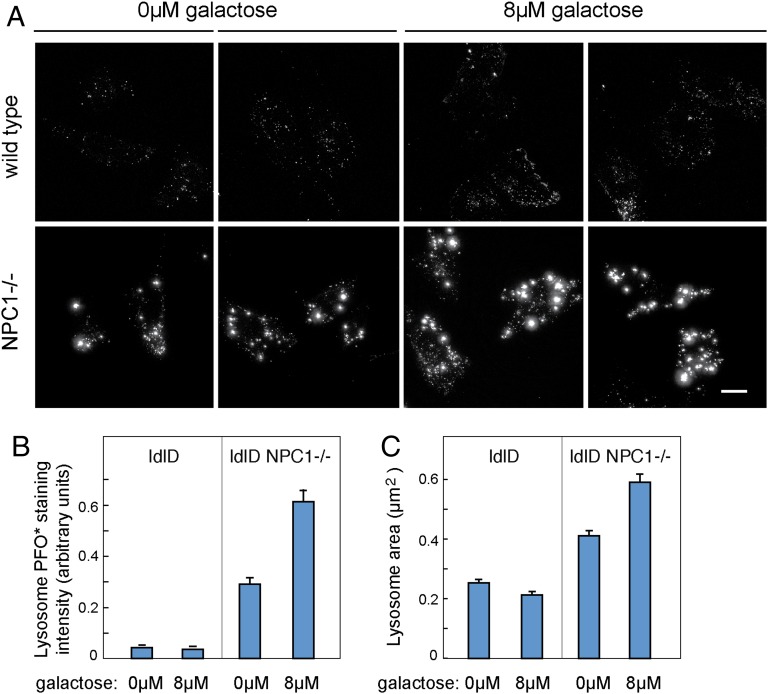
Fig. 4.
PFO* stained objects are brighter and larger in NPC1−/− CHO ldl-D cells in the presence of galactose. (A) Representative images of CHO ldl-D cells stained with PFO* under the indicated conditions. Images of wild-type cells (Top row) have been leveled five times brighter than they would appear compared with NPC1−/− cell levels. (Scale bar, 15 µm.) (B) Mean values of total intensity of PFO* objects per cell quantified using CellProfiler. (C) Mean values of the area of PFO* stained objects per cell in square micrometers as quantified by CellProfiler. Error bars, SEM. From Left to Right, 10, 9, 50, and 54 cells were analyzed with an average of more than 70 objects/cell/condition quantified. NPC1−/− populations were statistically different between themselves and compared with other populations with unpaired, two-tailed t test P values <0.001.

