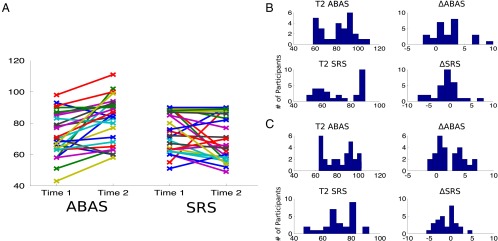
Fig. 1.
Outcome measures show change over time. (A) Adaptive Behavior Assessment System (ABAS) General Adaptive Composite standard scores (Left; n = 27) and Social Responsiveness Scale (SRS) sum t-scores (Right; n = 29) are shown for each participant at each time point. Higher ABAS scores indicate an improvement in adaptive behaviors whereas lower SRS scores indicate improvement in social functioning. (B) Histograms representing the distribution of scores for each of the four outcome measures. ΔSRS and ΔABAS (the change between time 1 and time 2 SRS and ABAS, respectively) have been converted to reliable change indices. (C) The same outcome measures are shown after linear effects of baseline score (ΔSRS and ΔABAS only), age, and follow-up latency have been removed. Note that these outcome measures retain considerable variability after this initial regression. These final measures are those that are predicted by the brain-based statistical models (Table 1 and Fig. 2).

