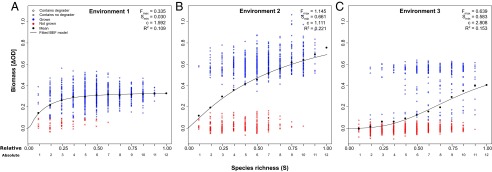
Fig. 1.
Biomass production (ΔOD) plotted against species richness in three different environmental scenarios: environment 1, 1 g/L benzoate (A); environment 2, 6 g/L benzoate (B); and environment 3, 6 g/L benzoate and 15 g/L NaCl (C). Communities are differentiated according to those communities containing no degrader (crosses) or at least one degrader (circles). Blue and red symbols indicate growing and nongrowing communities, respectively. For each species richness level, mean values (●) and modeled biomass production were calculated (Box 1). Model parameters include the theoretical maximum biomass (Fmax), functional redundancy (Smin), and coefficient of species interaction (c). Although the fitted BEF model is in good correspondence to the observations’ mean values, the R2 values underpin that functioning strongly depends on species composition in addition to species richness.

