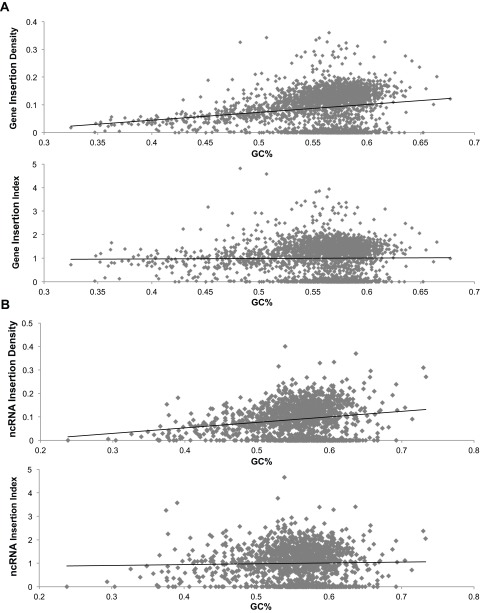
Fig. S3.
Normalizing for GC bias of insertion density. A, Upper shows the insertion density (y axis) for each gene compared with its GC% (x axis) before normalization. These values were normalized by dividing each insertion density by the trend line value for its GC%. A, Lower shows the insertion density normalized for GC% (insertion index). B, Upper shows the insertion density for each of the recently annotated ncRNAs (45) compared with its GC% before normalization. B, Lower shows the insertion density normalized for GC% (insertion index).

