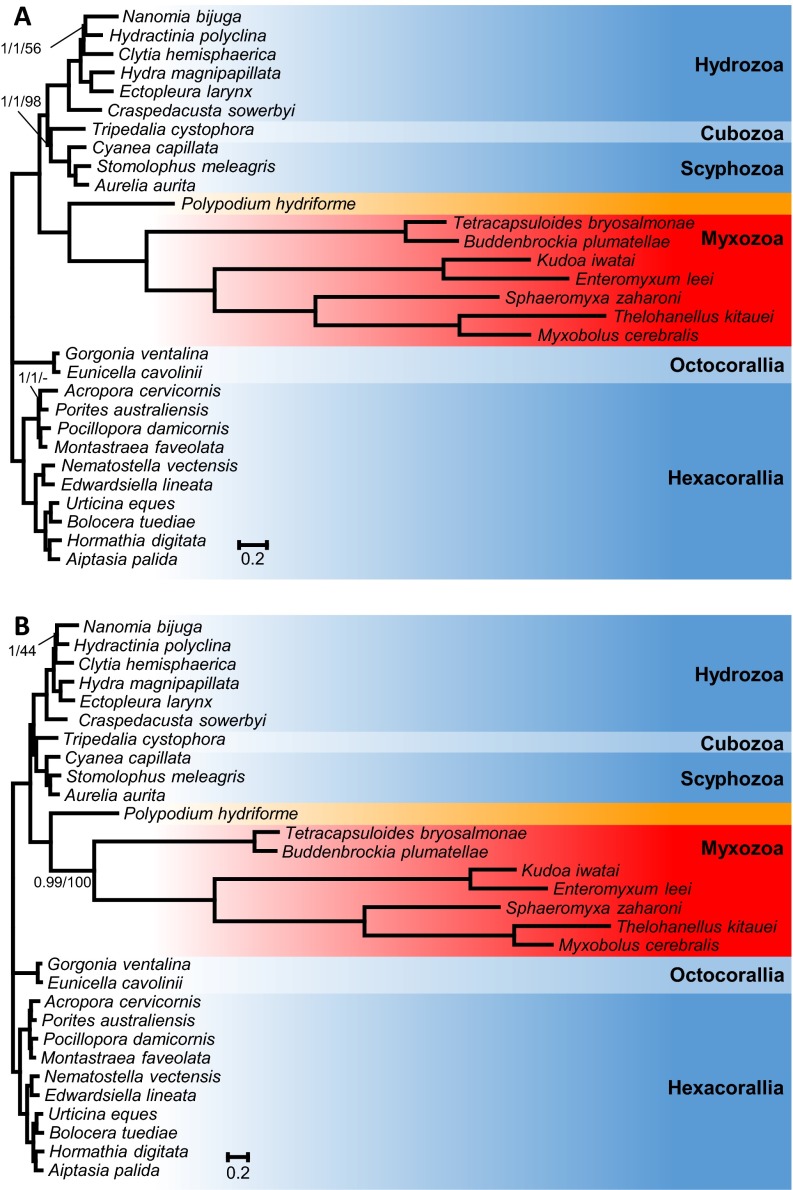
Fig. S2.
(A) Phylogenetic tree generated from a matrix of 51,940 amino acid sequences and 30 cnidarian taxa using Bayesian inference under the CAT model. Support values are indicated only for nodes that did not receive maximal support. Bayesian posterior probabilities under the CAT model/Bayesian posterior probabilities under the CAT-GTR model/ML bootstrap supports under the PROTGAMMAGTR are given near the corresponding node. A minus sign (‘‘–’’) indicates that the corresponding node is absent from the ML bootstrap consensus tree. (B) Phylogenetic tree generated from a matrix that excludes ribosomal genes, comprising 41,237 amino acid sequences and 30 cnidarian taxa using Bayesian inference under the CAT model. Support values are indicated only for nodes that did not receive maximal support. Bayesian posterior probabilities/ML bootstrap supports under the PROTGAMMAGTR are given near the corresponding node.

