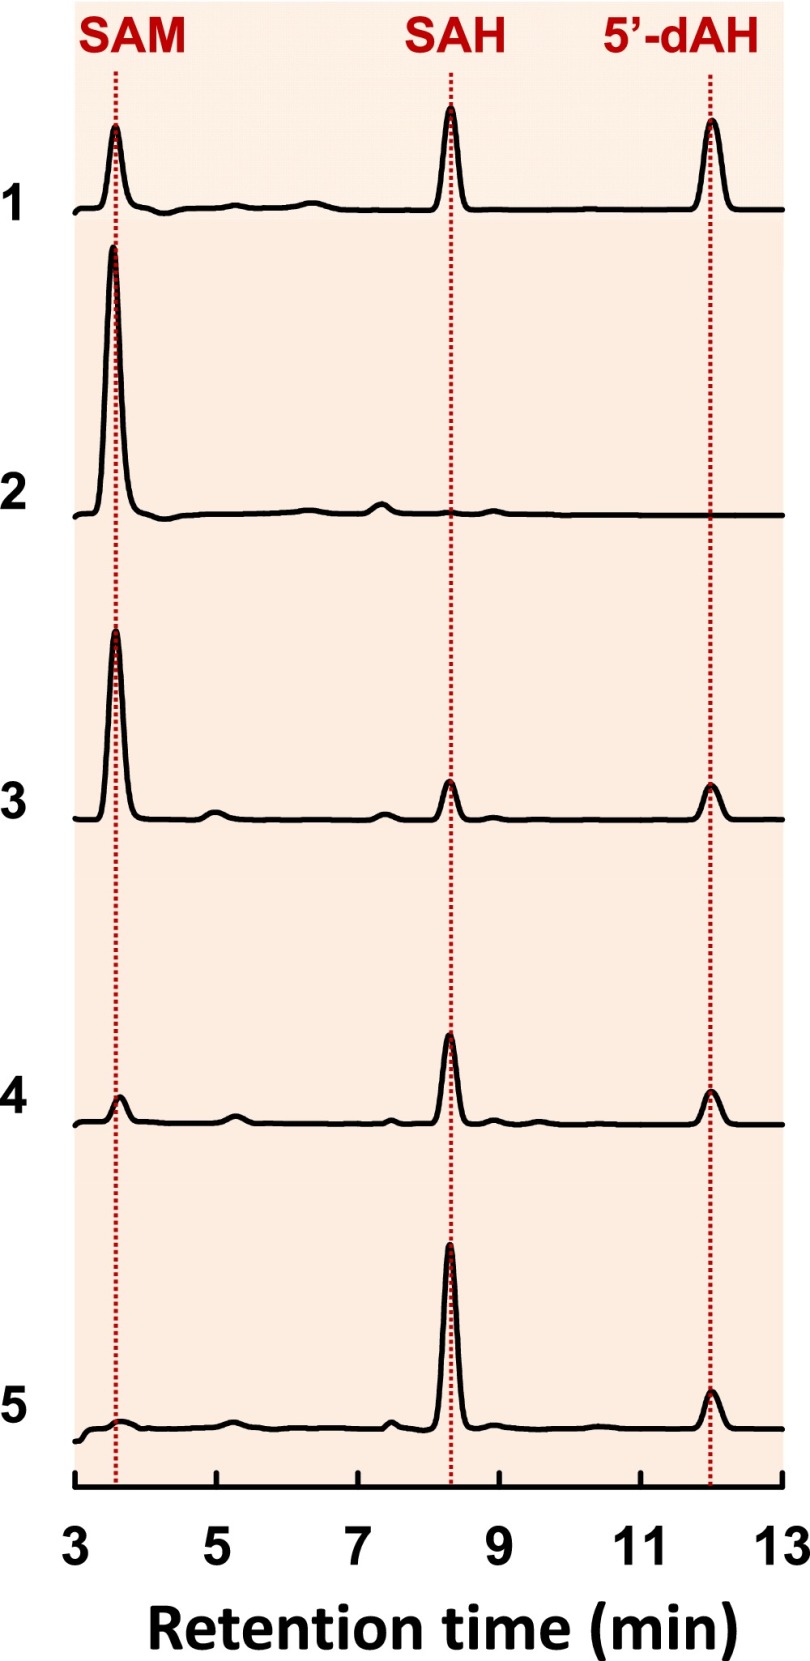
Fig. 2.
SAM cleavage by NifBMa and NifBMt. HPLC elution profiles of (1) SAM, SAH, and 5′-dAH standards, (2) SAM alone, (3) SAM plus NifEN-B, (4) SAM plus NifBMa, and (5) SAM plus NifBMt. All samples contained dithionite. SAH was formed in the amounts of 0.20, 0.46, and 0.96 nanomole, respectively, per nanomole of NifEN-B, NifBMa, and NifBMt, whereas 5′-dAH was formed in the amounts of 0.18, 0.17, and 0.18 nanomole, respectively, per nanomole of NifEN-B, NifBMa, and NifBMt.

