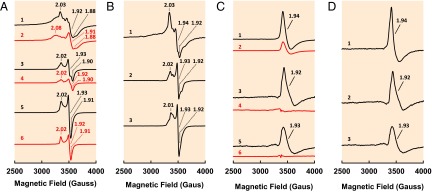
Fig. 3.
EPR properties of NifBMa and NifBMt. (A) EPR spectra of dithionite-reduced (1) NifEN-B, (2) NifEN-B plus SAM, (3) NifBMa, (4) NifBMa plus SAM, (5) NifBMt, and (6) NifBMt plus SAM. Spectra were collected in perpendicular mode at 50 mW and 10 K. (B) Difference spectra between untreated and SAM-treated (1) NifEN-B, (2) NifBMa, and (3) NifBMt in the dithionite-reduced state. All difference spectra were derived from the corresponding spectra in A and multiplied by a factor of 1.5 for better visualization of features. (C) EPR spectra of IDS-oxidized (1) NifEN-B plus SAM, (2) NifEN-B, (3) NifBMa plus SAM, (4) NifBMa, (5) NifBMt plus SAM, and (6) NifBMt. The spectra of NifEN-B plus SAM (C, 1) and NifEN-B (C, 2) were multiplied by a factor of 0.5 for better adaptation to the size of the graph. The untreated NifEN-B contained some L clusters (C, 2) and, upon SAM treatment, more L clusters were generated in this protein (C, 1), as indicated by an increase in the magnitude of the L-cluster–specific, g = 1.94 signal. Spectra were collected in perpendicular mode at 50 mW and 15 K. (D) Difference spectra between untreated and SAM-treated (1) NifEN-B, (2) NifBMa, and (3) NifBMt in the IDS-oxidized state. All difference spectra were derived from the corresponding spectra in C, and the difference spectrum of NifEN-B (D, 1) was multiplied by a factor of 2. The g values are indicated.

