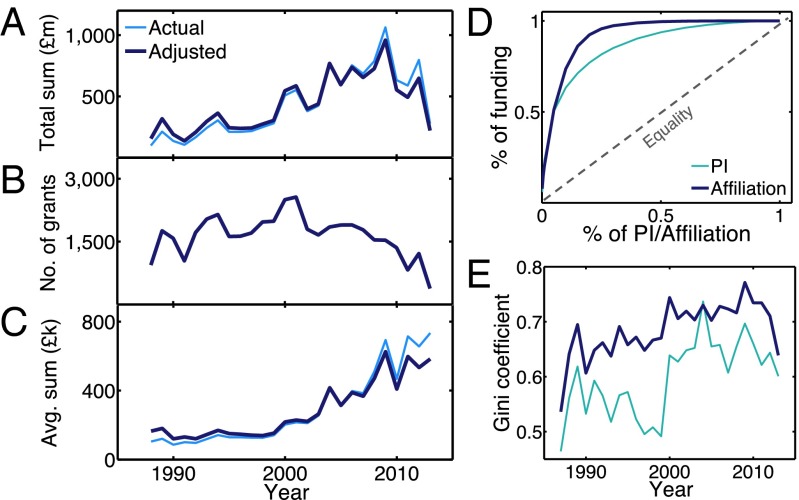
Fig. 1.
The funding landscape over the last three decades. (A) The total amount of funding awarded by EPSRC showed a general increase, with a peak in 2009, and then a decrease. “Actual” refers to the actual value on record and “adjusted” refers to the value after the adjustment made with reference to the Consumer Prices Index (Materials and Methods). (B) The total number of grants awarded by EPSRC peaked in 2001. (C) The average amount of funding per grant continued to rise over time. (D) Overall distribution of funding among PIs and affiliations. Individual awardees (PIs or affiliations) were sorted in descending order of their total awarded funding, and the percentage of funding was plotted against the corresponding percentage of awardees. The dotted line denotes where true equality lies and both cases showed strong inequality. (E) Distribution of funding consistently showed a high degree of inequality over time, in both cases of PIs and affiliations.

