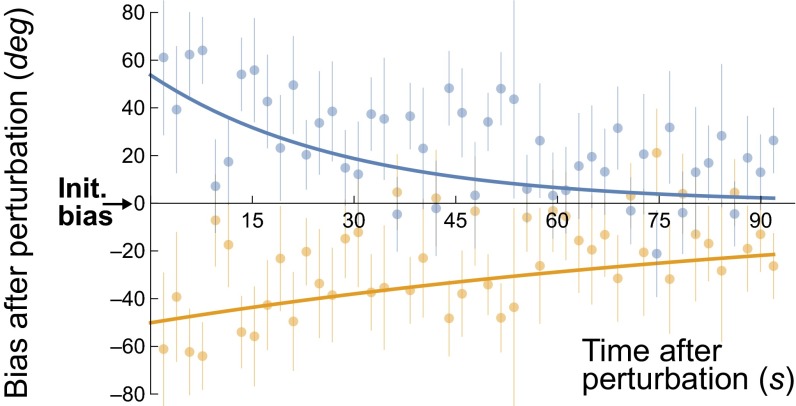
Fig. 4.
The effect of deliberate perturbation on the biases using nonambiguous stimuli (experiment 5). Data are shown for one representative participant for TFM stimuli (data for all participants are shown in SI Appendix, Fig. S11). The x axis shows the time immediately following the perturbation in seconds. The y axis shows the effect of the perturbation: the difference in degrees between the measured direction bias and the initial, preperturbation bias. On every other block, the perturbation stimuli were chosen between +90 and +135 degrees away from the initial bias direction (blue dots, bars, and curves), whereas on the other blocks the perturbation was in the opposite direction, between –90 and –135 (orange). Error bars denote SEs over multiple blocks. The curves are exponential fits.

