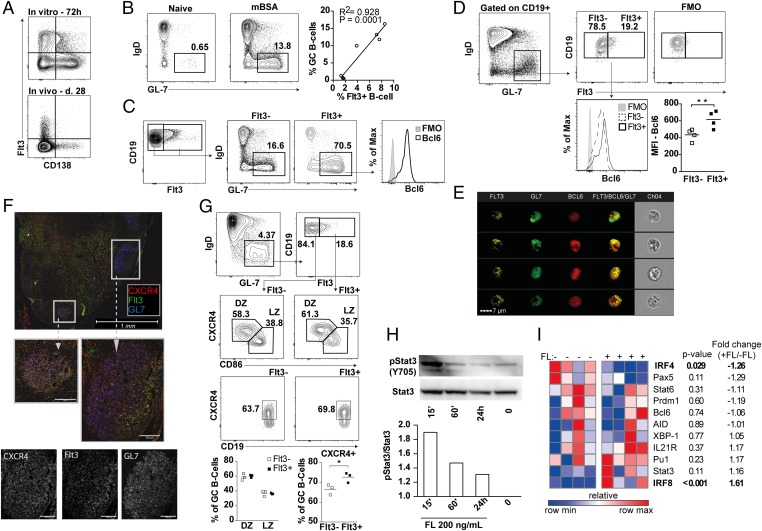
Fig. 2.
Flt3 is expressed on GC B cells. (A) Expression of Flt3 and CD138 on splenic lymphocytes from mBSA-immunized mice at day 28 in vivo and after in vitro LPS stimulation of splenocytes for 72 h. Cells are gated on a total mononuclear-viable population. FMO, fluorochrome minus one staining control. (B) Frequency of GC B cells (CD19+GL-7+IgD−) at day 10 in naïve and mBSA-immunized WT mice. The correlation between the frequency of Flt3+ and GC B cells in LNs at day 10 is shown. (C) Expression of Flt3 on GC B cells. (D) Level of Bcl6 expression in Flt3+ and Flt3− GC B cells. (E) Imaging flow cytometry illustrates expression of Bcl6 and Flt3 on GL-7+ GC B cells. (F) Immunofluorescent staining for Flt3 and CXCR4 on GL-7+ GC B cells in LNs of OVA-immunized mice. (G) Frequency of Flt3+ cells within the DZ (CXCR4+CD86lo) and the LZ (CXCR4−CD83HI) of GC. Expression of CXCR4 on the total Flt3+ and Flt3− GC B-cell population is shown. (H) Level of pStat3 (Y705) and total Stat3 after 15 min (15´), 60 min (60´), and 24 h of stimulation with 200 ng/mL rmFL. (I) Gene expression heat map of activated B cells stimulated with 200 ng/mL rmFL for 20 h. *P < 0.05, **P < 0.01, ***P < 0.001. Statistical analysis was performed using the unpaired Student’s t test.

