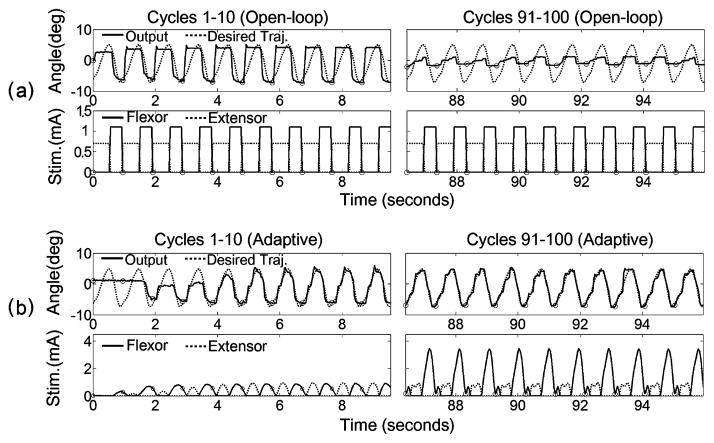
Fig. 3.
Example of open-loop and PG/PS adaptive control outputs and stimulation levels for hindlimb D. (a) Open-loop stimulation pattern (bottom) and movement pattern (top) during the first ten cycles and the last ten cycles of a single 100-cycle trial. (b) PG/PS adaptive control system stimulation pattern (bottom) and movement pattern (top) during the first ten cycles and the last ten cycles of the 100-cycle trial. The top rows of (a) and (b) show desired (dotted) and measured angle output (solid) trajectories and the bottom rows show stimulus current pulse amplitude patterns delivered to the muscles. The horizontal axis shows time (in seconds); the vertical axis shows joint angle (in degrees) with hip extension defined as positive. The small circles indicate the onset of a cycle. The stimulation current pulse pattern is the envelope of the stimulation current pulse amplitude updated by the controller at 25 Hz for the PG/PS control system, whereas the open-loop control system used predetermined stimulus current pulse amplitude envelopes. These plots demonstrate that the open-loop control system achieved good movement excursion at the beginning of the trial, but this was substantially reduced toward the end; the adaptive control system quickly learned to achieve very good movement tracking, and this was maintained through the end of the trial by automatically adjusting the stimulation patterns.

