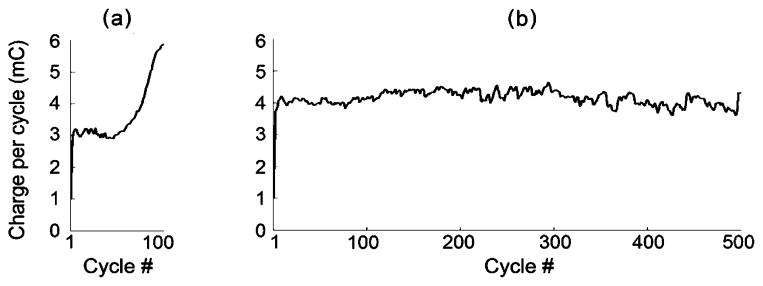
Fig. 9.
Example of charge delivered per cycle by the adaptive control system to the flexor (hindlimb B) during (a) continuous (100 cycles—ON) and (b) intermittent movement trials (100 sets of five movement cycle bouts with 20-s rest periods interspersed). The charge per cycle was calculated as the total summation of the product of width and amplitude of the cathodic phases of the pulses during a cycle. The maximum stimulation current pulse amplitudes at the end of the continuous and intermittent trials were 5.2 and 3.9 mA, respectively. Note that the charge per cycle steadily increased throughout the continuous trial, but reached a plateau and was sustained during the intermittent trials. These plots suggest that fatigue increased throughout the latter half of the continuous movement trial but that the muscle fatigue had reached a plateau during the intermittent trial.

