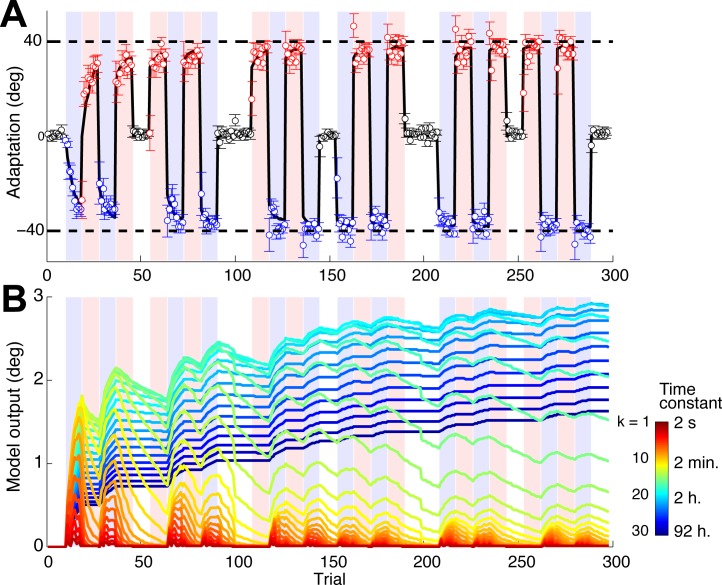
Fig 2. Mean subject adaptation and model fit.
(A) Blue, red, and black circles indicate directions of joystick movements in Task 1 (40° rotation), Task 2 (−40°), and Control (0°), respectively, averaged across subjects (N = 21). Blue or red shaded regions indicate trials in Task 1 or 2, respectively. Regions with no shading indicate control trials. The thick black line indicates motor output, y of the multistate model (Eq 1). Error bars denote the standard error of the mean. (B) Trajectories of individual states of memory for Task 1, x k,1 (Eqs 1 and 2) of the fitted model. Colors indicate state numbers (k = 1,…,30) and corresponding time constants (τ k) as indicated by the color bar (see also S1 Table). Data of the model fit are available in S1 Data.

