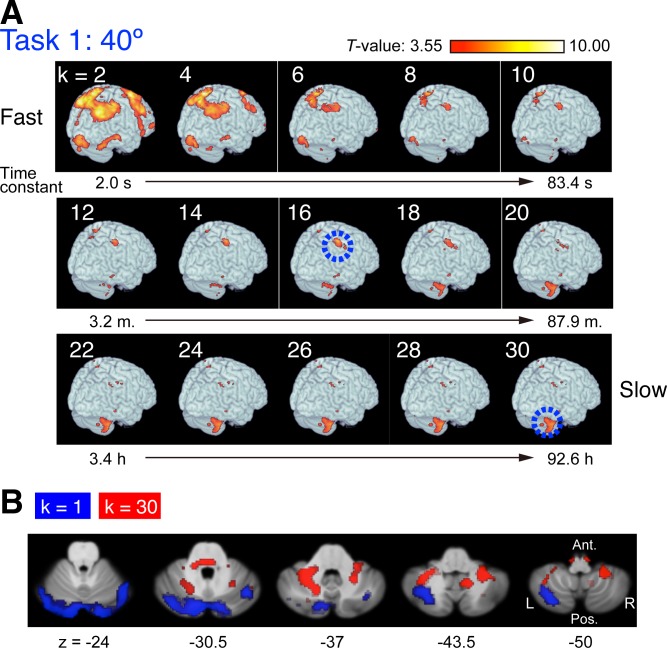
Fig 3. Correlated regions for individual states of motor memory with different time constants.
(A) Red-yellow regions indicate regions where BOLD signal time courses were significantly correlated with individual states of motor memory (Fig 2B) (p < 0.001 uncorrected for multiple comparisons, see Materials and Methods). Color-coded T-values of regression coefficients are rendered on the right posterior view of the brain surfaces. The two blue circles indicate the anterior regions of the inferior parietal lobe and the cerebellum, which are consistently responsible for intermediate (k = 11,…,20) and slow states (k = 21,…,30). s: second, m: minute, h: hour (see also S1 and S2 Videos). (B) Regional difference in the cerebellum between the fastest (k = 1) and slowest (k = 30) states. Regions related to each state are indicated in the transverse sections from the superior (the left panel) to the inferior (the right panel) sections (see also S1 Fig). Data of the statistical maps are available in S2 Data.

