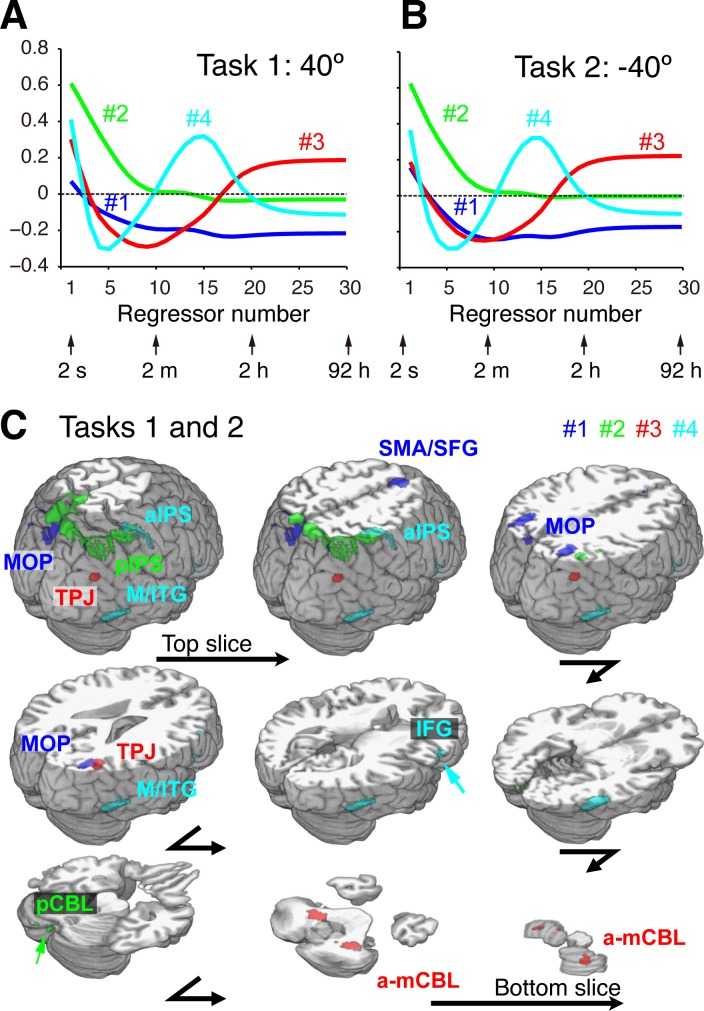
Fig 4. Eigenvariates and eigenimages of brain activity related to different timescales of sensorimotor memory.
(A) and (B) Eigenvariates as a function of regressor number corresponding to different time constants for Tasks 1 and 2, respectively. (C) Eigenimages rendered on the brain surface and transverse slices at different levels. Eigenimages are thresholded so that the top 10% of the voxels are included for each component. Overlapped images between Tasks 1 and 2 are rendered (see S6 Fig and S2–S9 Tables for each task). SMA/SFG, supplementary motor area/superior frontal gyrus; MOP, medial occipitoparietal regions; aIPS, anterior part of intraparietal sulcus; pIPS, posterior part of intraparietal sulcus; TPJ, temporoparietal junction; IFG, inferior frontal gyrus; M/ITG, middle/inferior temporal gyri; a-mCBL, anterior-medial cerebellum; pCBL, posterior cerebellum. Data of T- values, to which the SVD analysis was applied, are available in S3 Data. Data of eigenvariates in Fig 4A and 4B are available in S4 Data. Data of eigenimages in Fig 4C are available in S5 Data.

