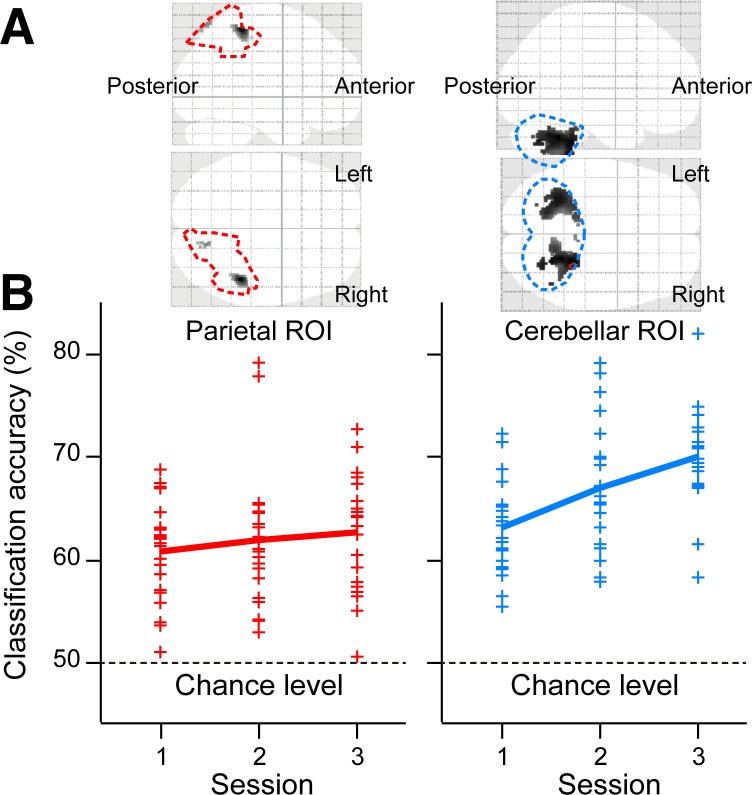
Fig 5. Regions of interest (ROIs) and classification accuracy of multivoxel pattern analysis.
(A) Functional ROIs to which multivoxel pattern analysis was applied (gray-black regions). Broken lines indicate anatomical ROIs (red: the superior and the inferior parietal lobes; cyan: the cerebellum). Left and right panels indicate the parietal and cerebellar ROIs, respectively. Top and bottom panels show the regions projected to the sagittal and the transverse planes, respectively. (B) Classification accuracy of Tasks 1 and 2 as a function of sessions using activity patterns in the above functional ROIs. A plus (+) marker indicates accuracy averaged within each subject according to cross-validation tests (see Materials and Methods). Thick lines indicate accuracy averaged across subjects. Data of the individual classification accuracy are available in S6 Data.

